Large databases of measurements from the field are a powerful tool to understand forest conditions, forest trends, and variations across an ownership or region. This information is essential to understanding the ecological, economic, and cultural resources a forest can provide–both in the present and in the future.
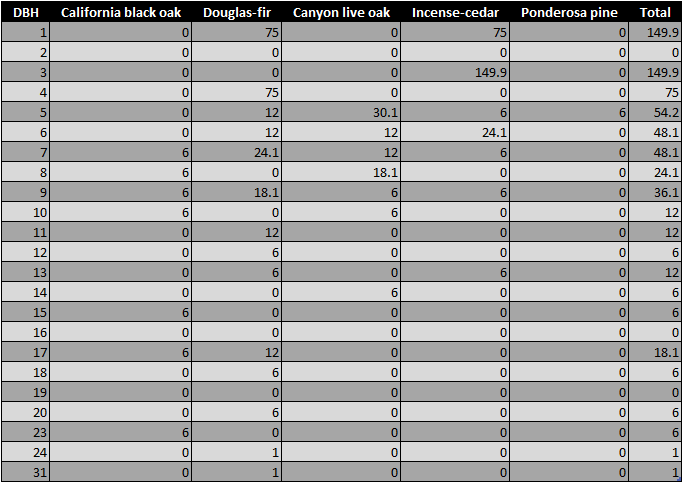
However, it can be intimidating to browse these databases, look for answers, and attempt to convey information. It is certainly easy to get lost in the numbers and it can take years to develop the frame of reference needed to understand forestry data. We can do some math and describe a stand in terms of basal area per acre, quadratic mean diameter, and stand density index, but what do these values mean? We can describe forest structure and composition using a stand table, but can you picture this stand in your mind just by looking at the table below? Is the picture in your mind the same as that of your colleagues?
In this blog post, we will explore one way to make forest inventory data more accessible and more engaging using forest visualizations from Visual Forester: Stand Designer. This will allow you to convey and discuss your data and your management proposals with a much larger audience and will help to facilitate more productive conversations. Additionally, forest visualization is a great way to engage with students and show them forests across the country while teaching some statistics, data analysis, and observational skills along the way.
Learning about America’s forests using FIA data
We could easily build visualizations from any forest inventory database, but for this example, we will use the database maintained by the Forest Service FIA program. The FIA (Forest Inventory and Analysis) database covers most of the forested parts of the U.S, contains very rich data at each plot, and is free to access. The FIA website includes some fact-sheets about America’s forests as well as some tools to auto-generate reports for particular areas and information types. Alternatively, you can download the full extent of the database and dive in yourself. Popular with researchers of many specialities, there are endless ways to utilize the information in the FIA database.
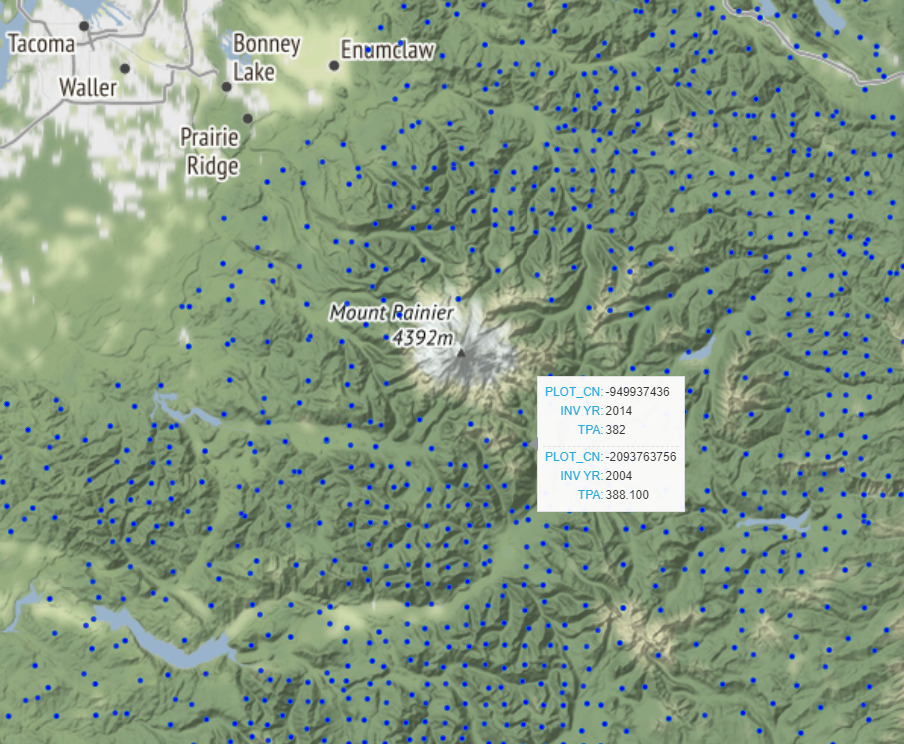
There are also numerous tools and methods available to extract information from big data sources like the FIA database. Many of these tools require some scripting/database skills. In this case, to make visualizations quick and easy, we created a simple stand-alone utility where you find plots on a map and type in the plot ID numbers to pick out data. The plot data is then automatically rearranged into a stand table that can be loaded straight into Stand Designer. You can find a link to download this application on the “Get More Data” page of the Stand Designer manual.
Visualizing plot data in Stand Designer
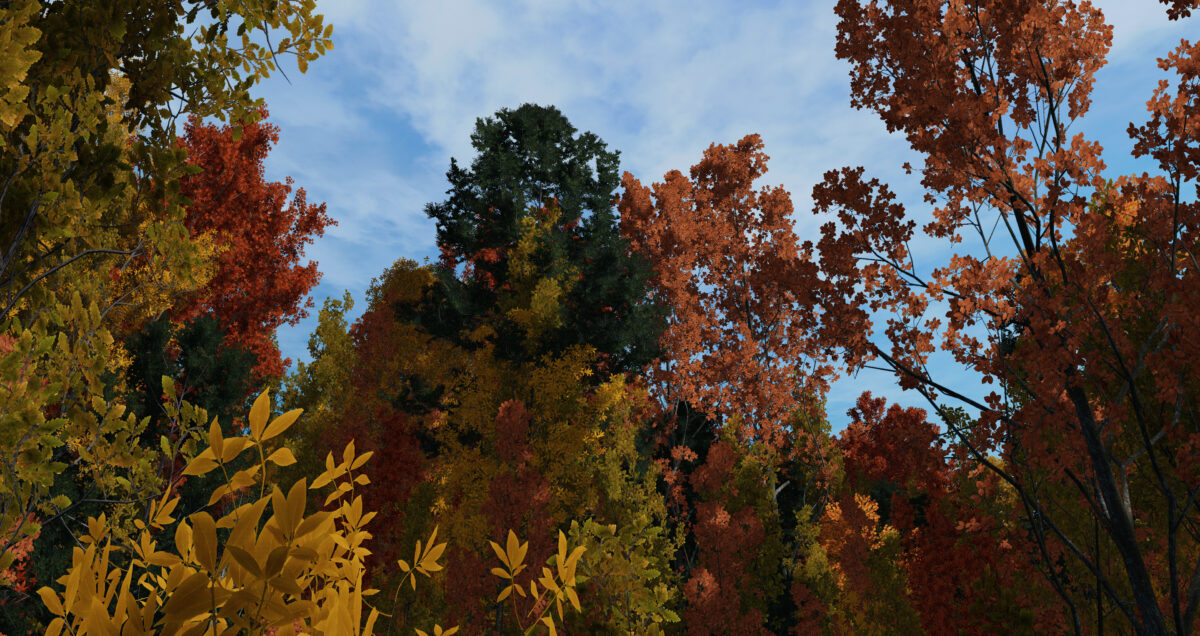
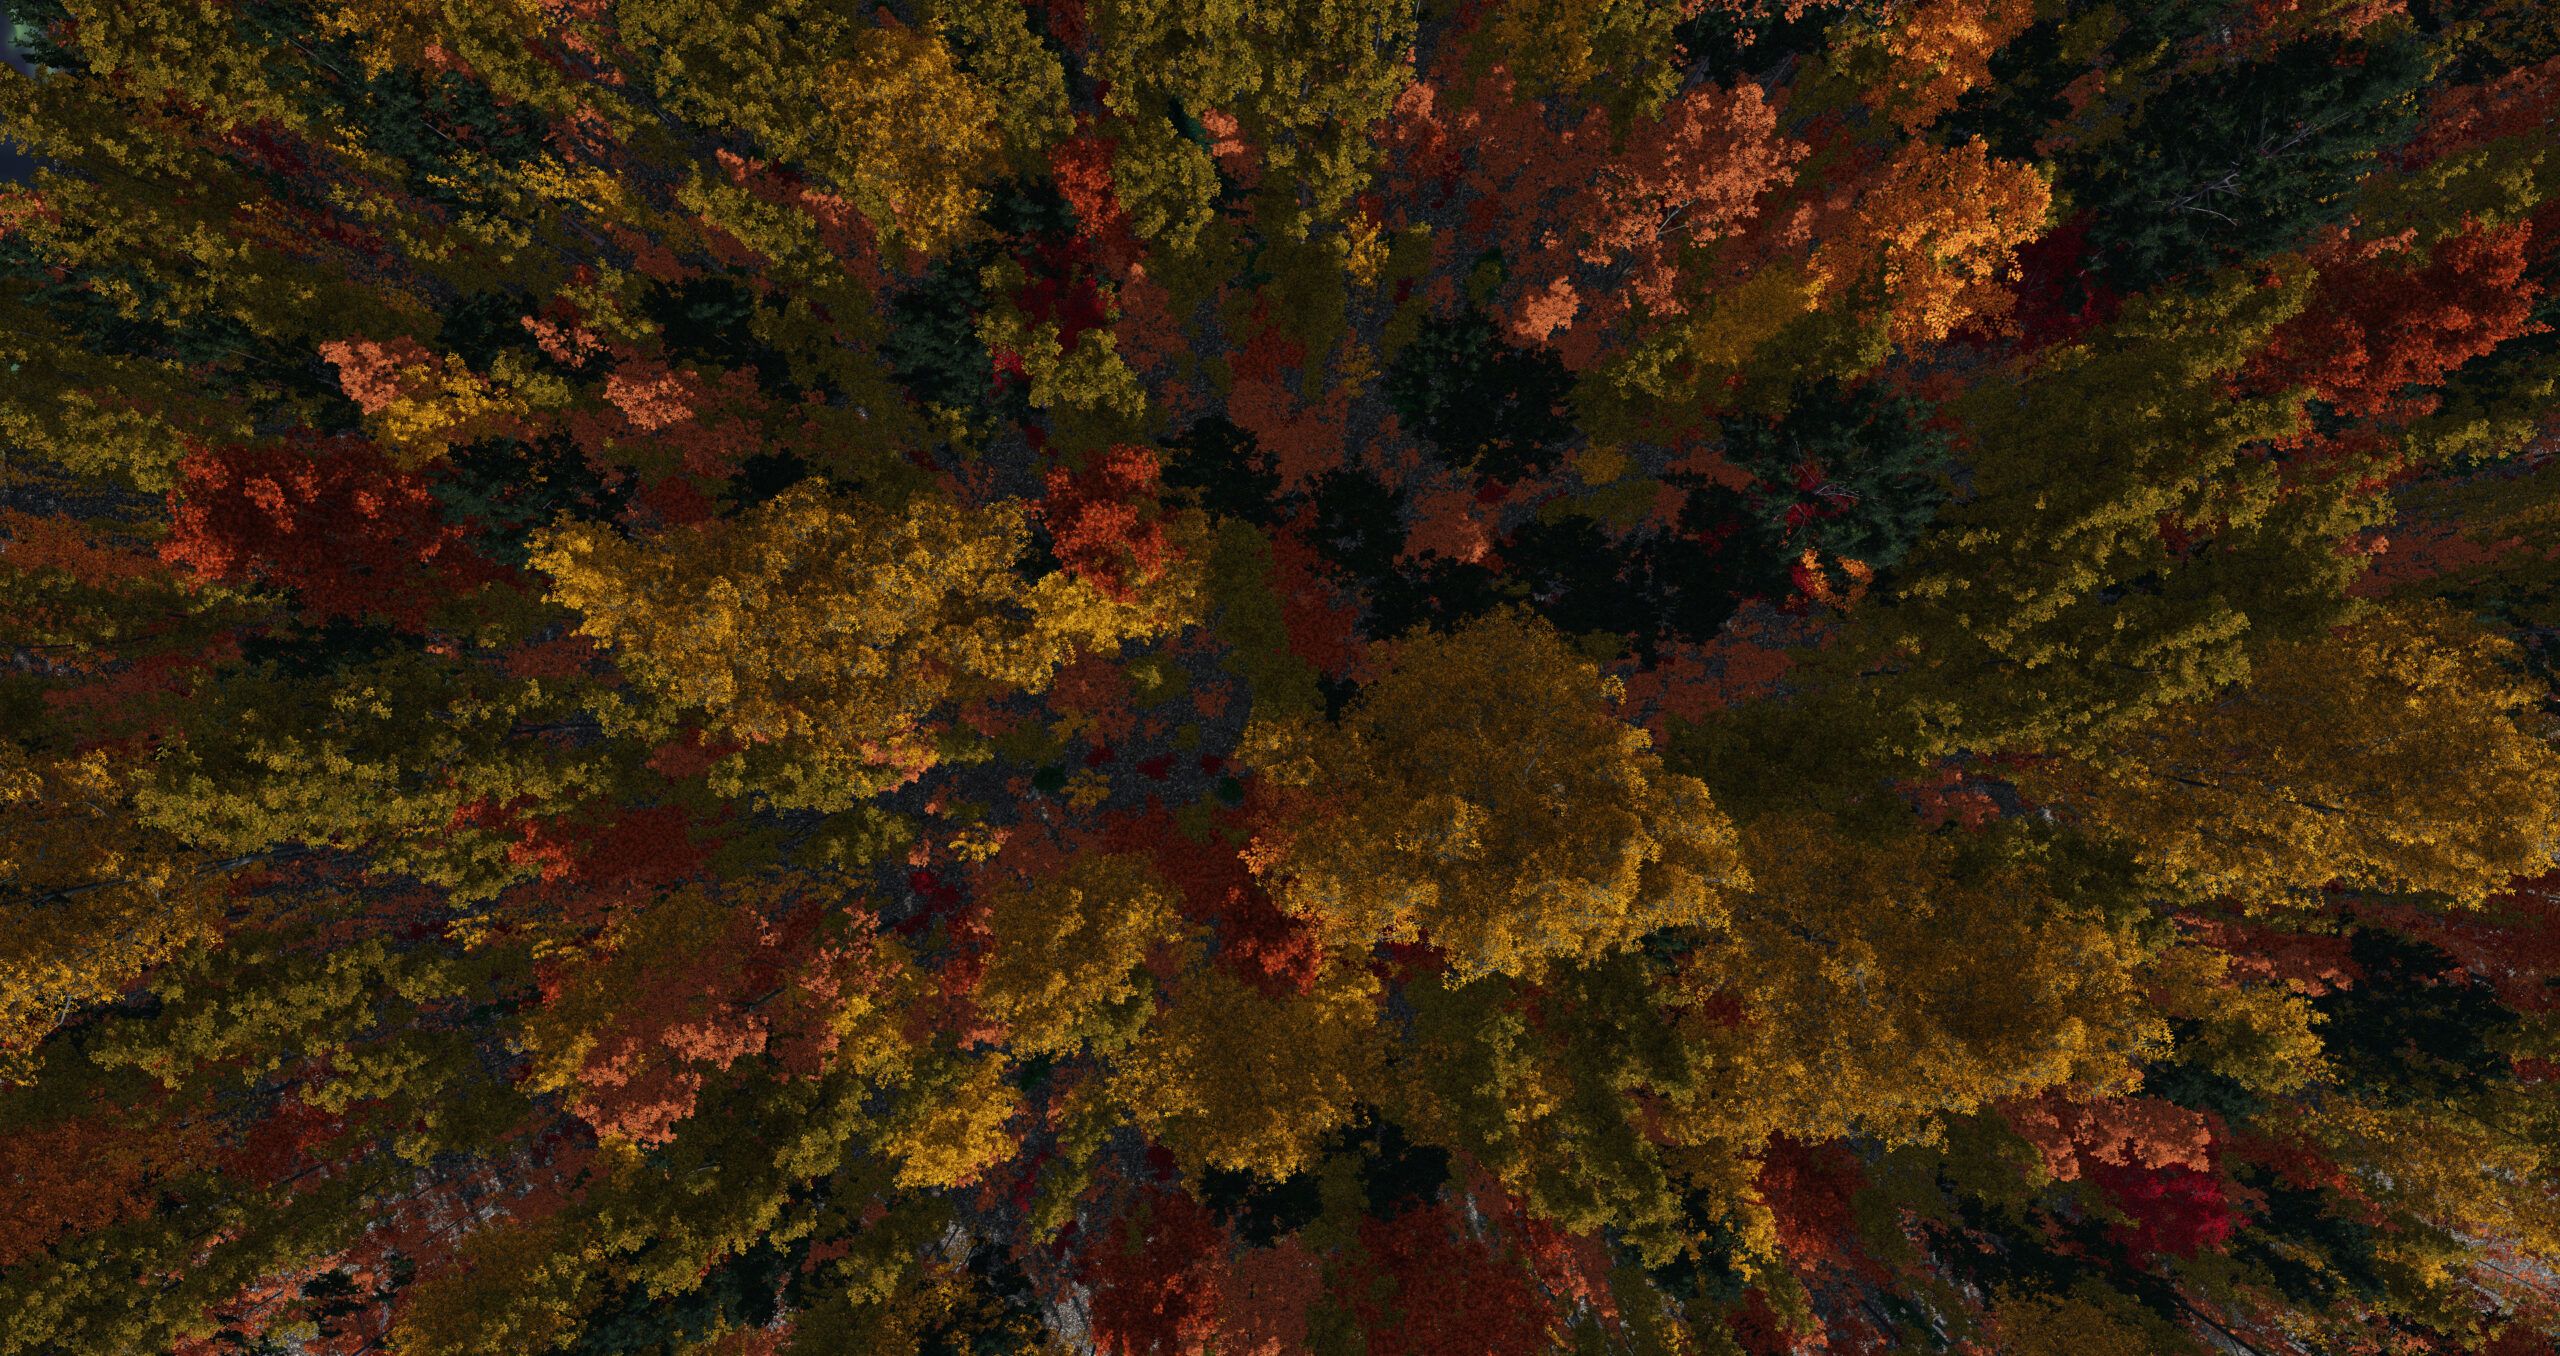
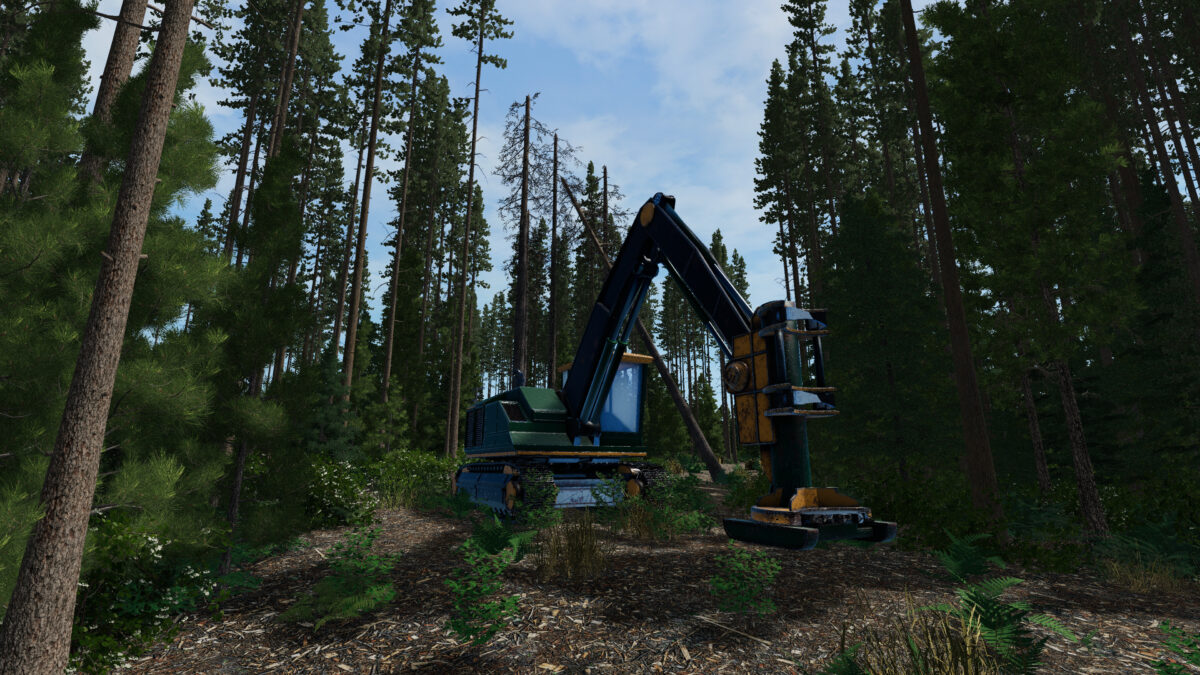
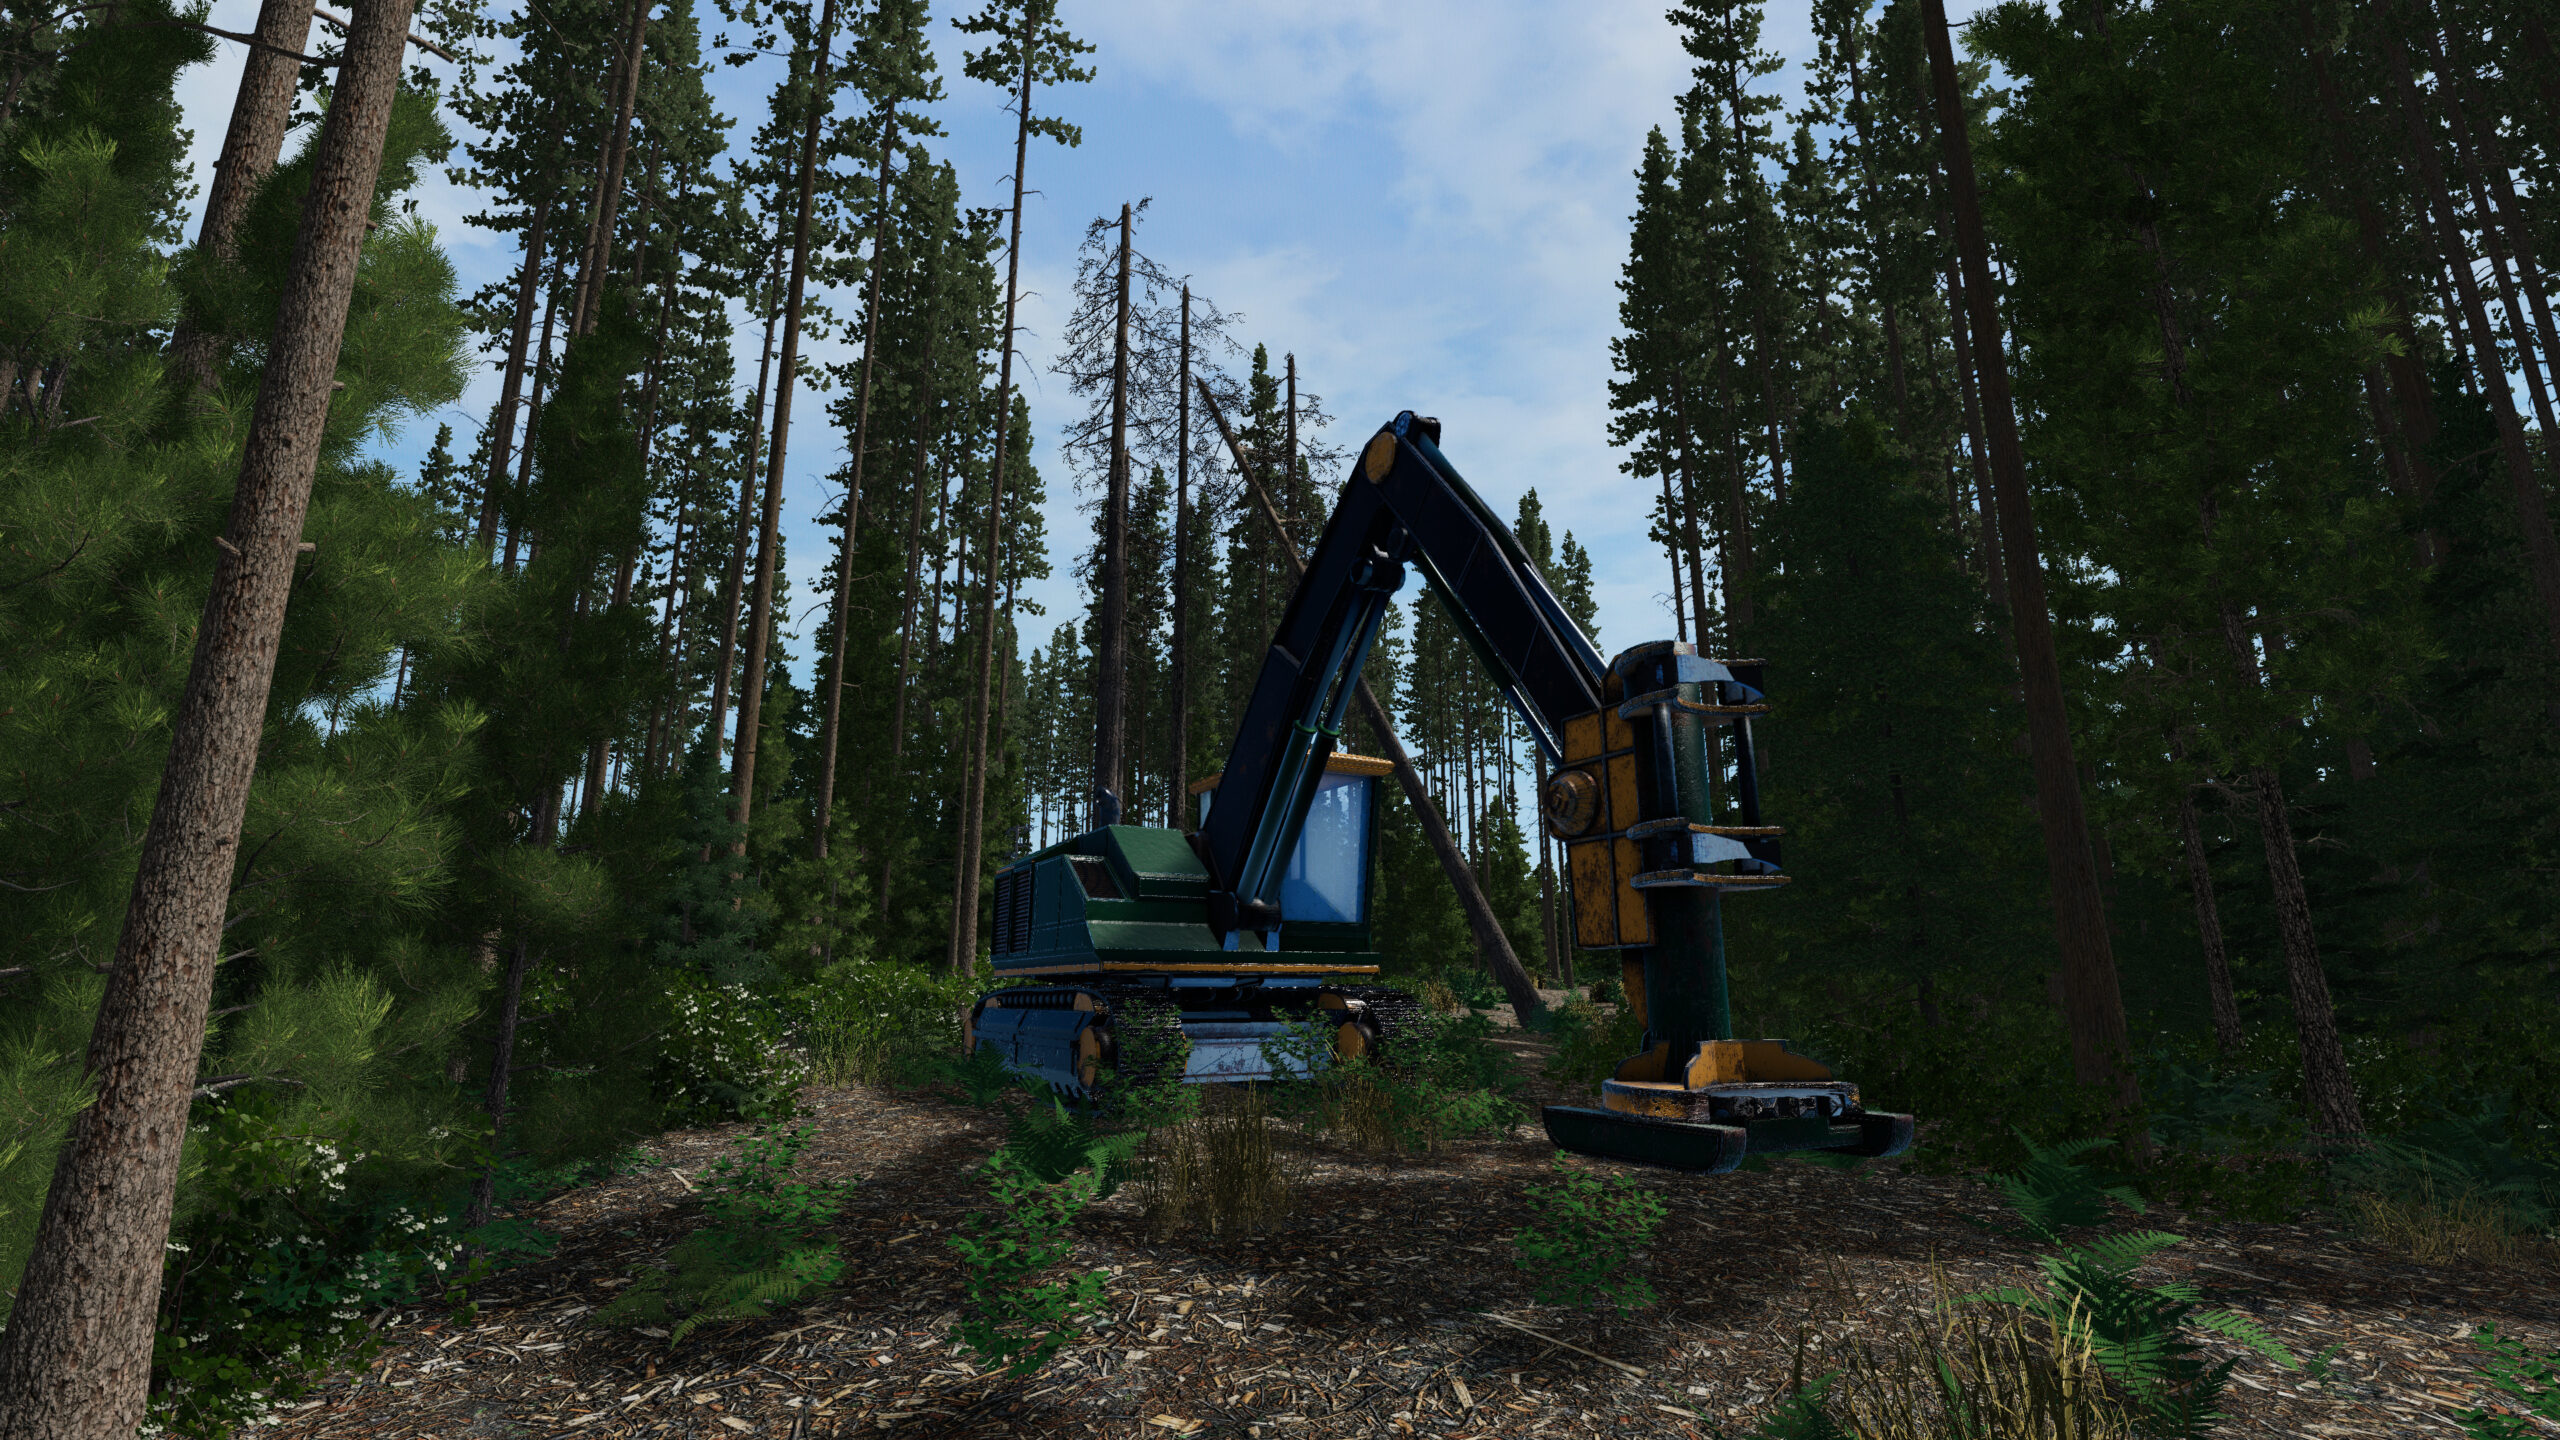
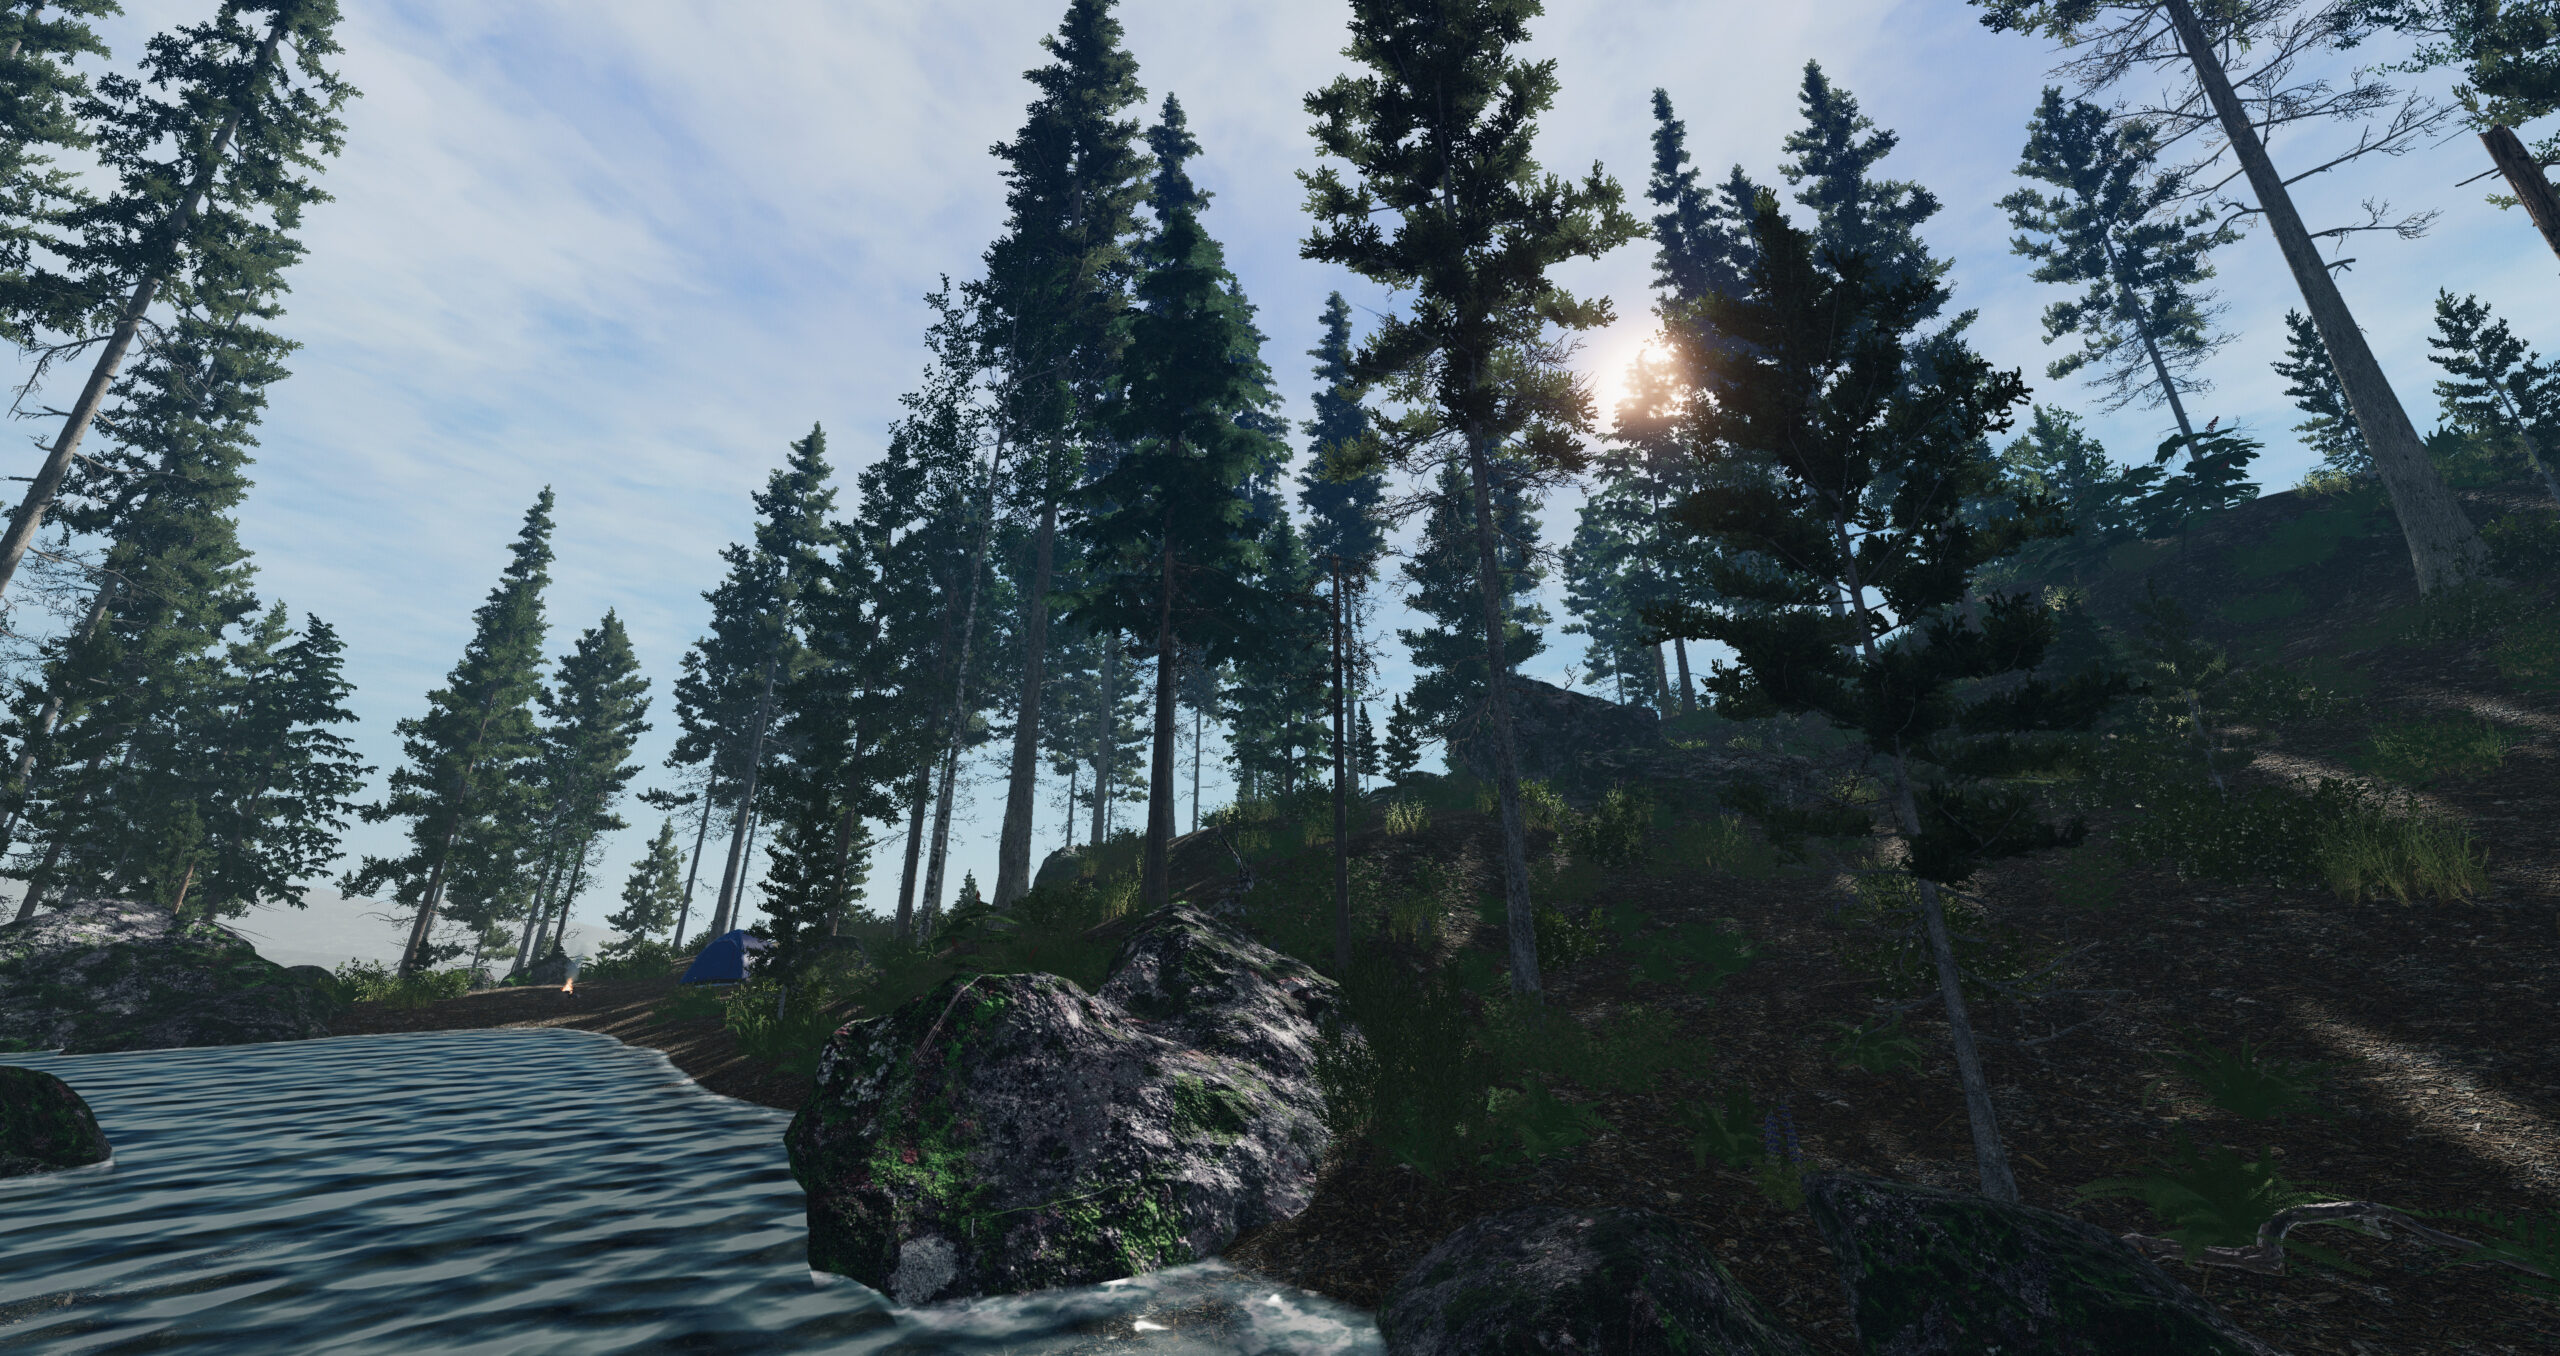
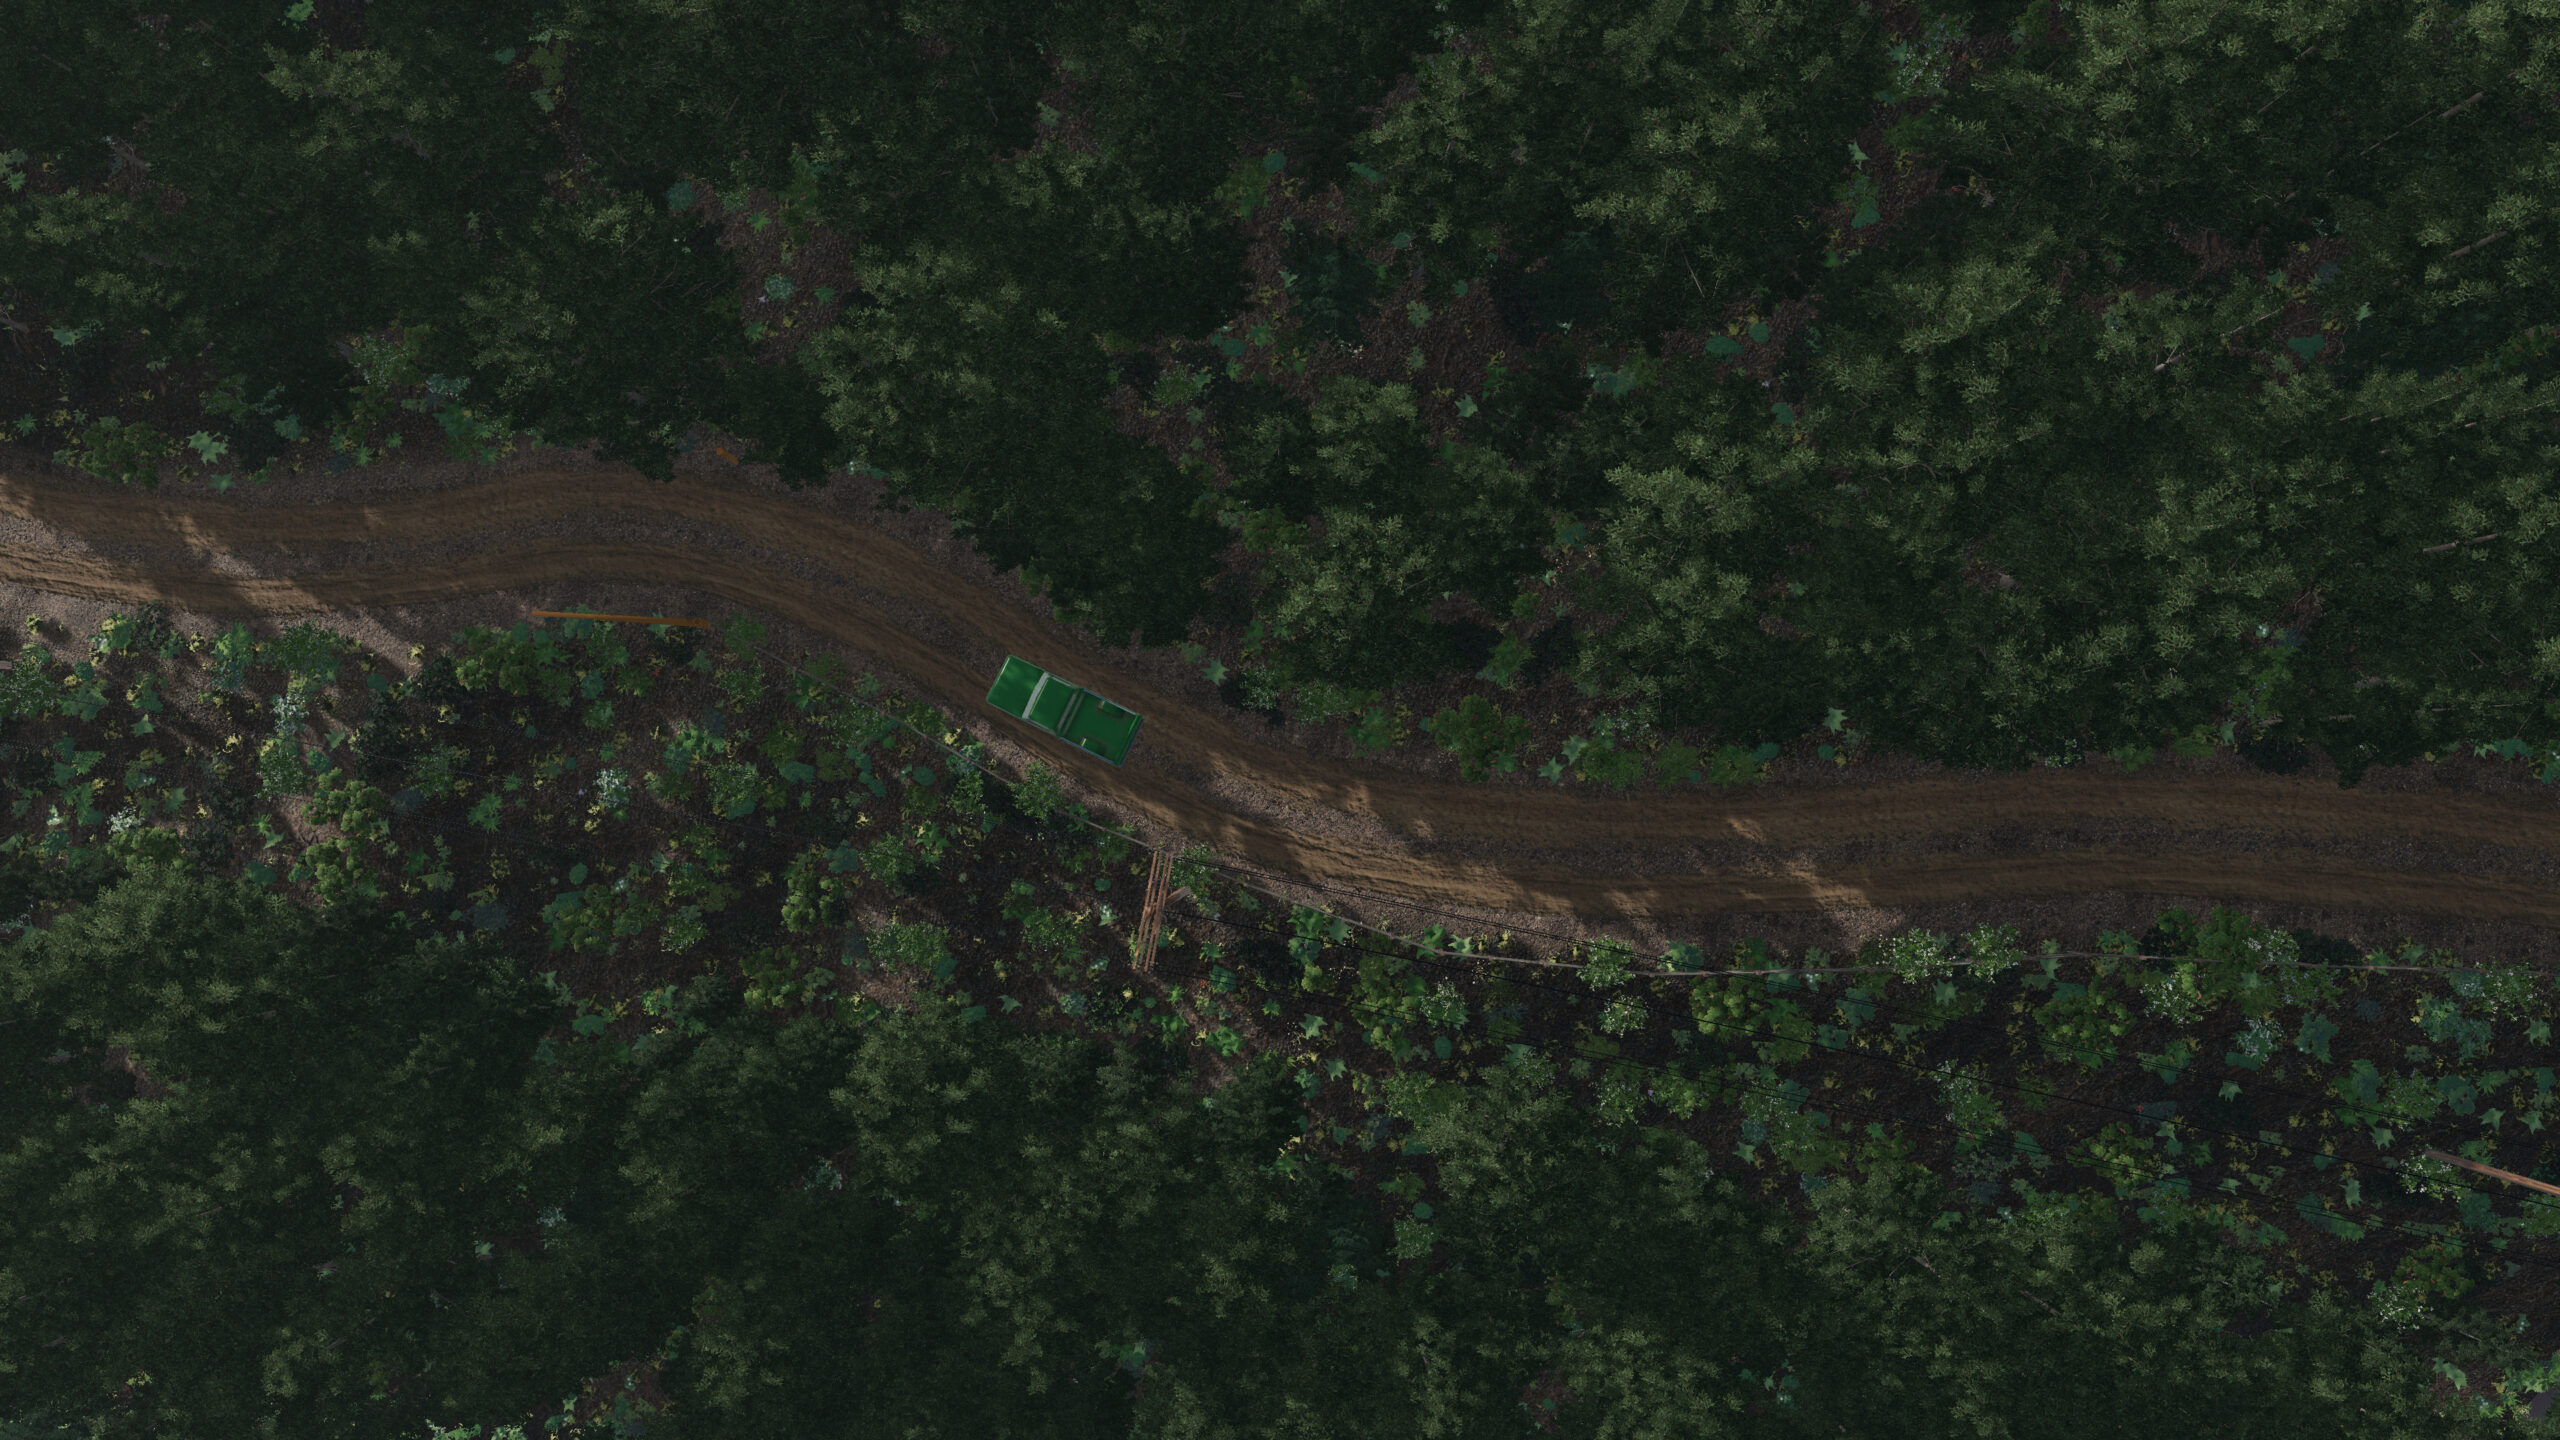
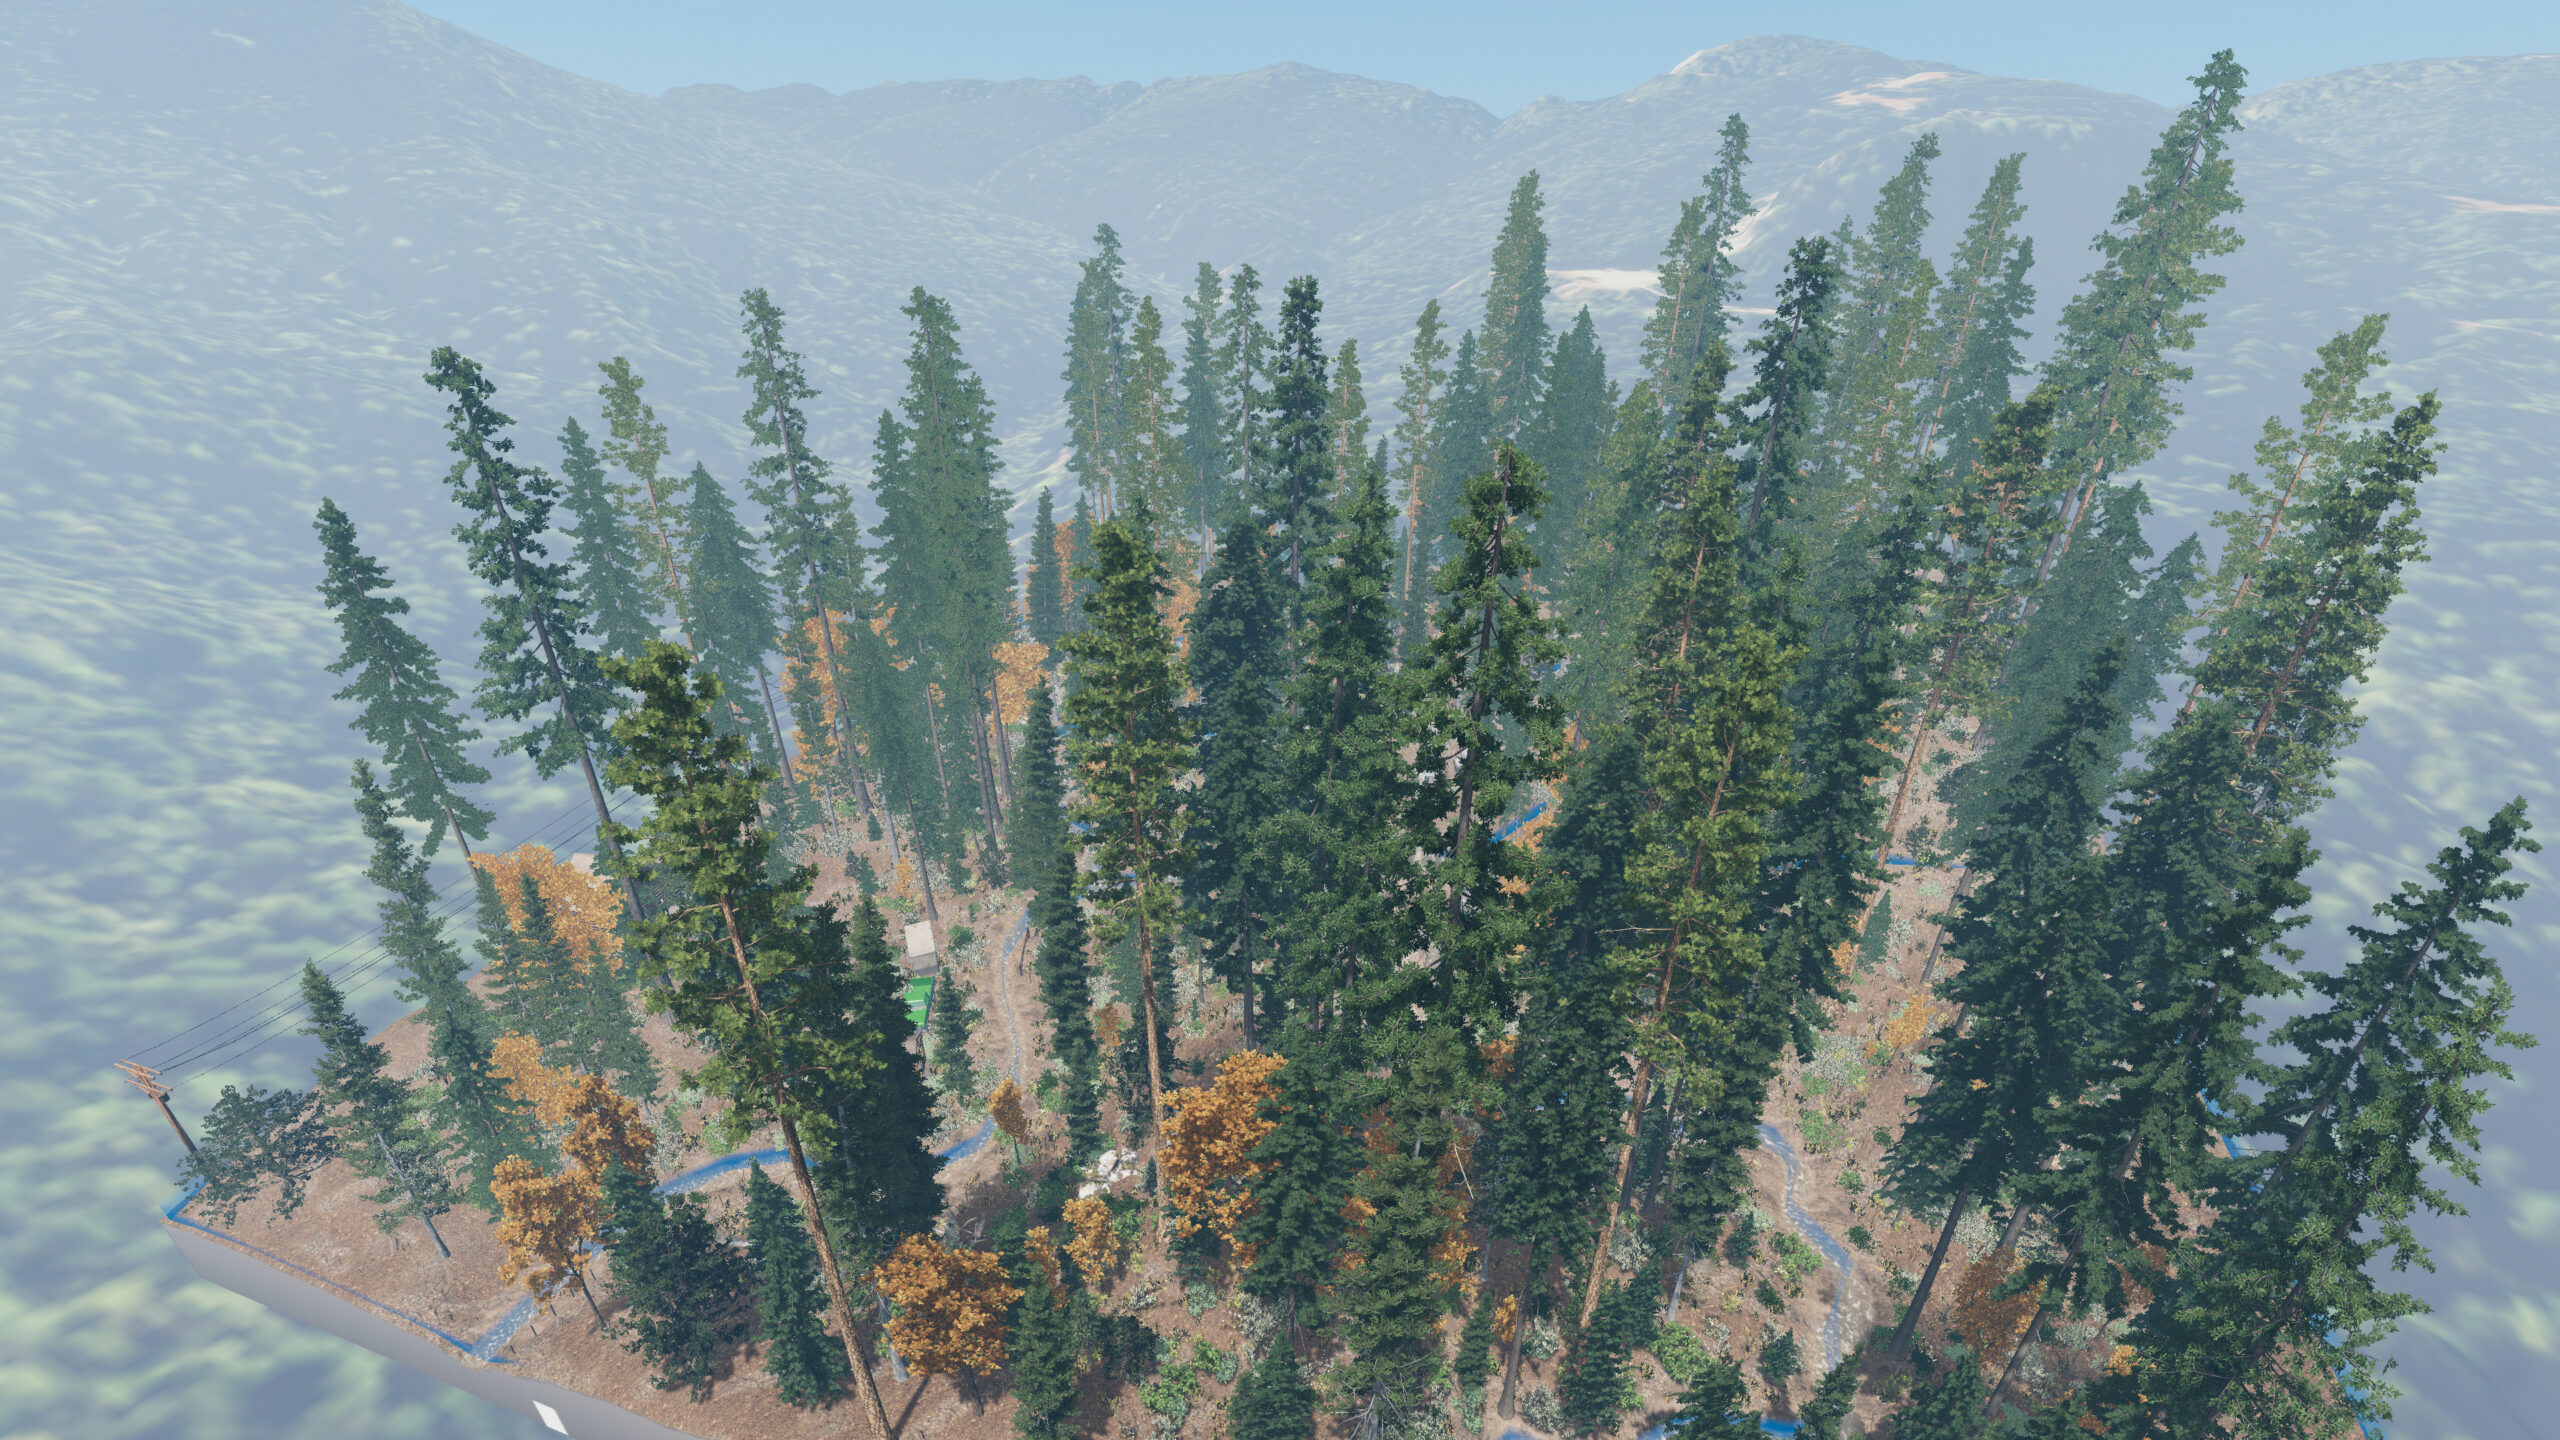
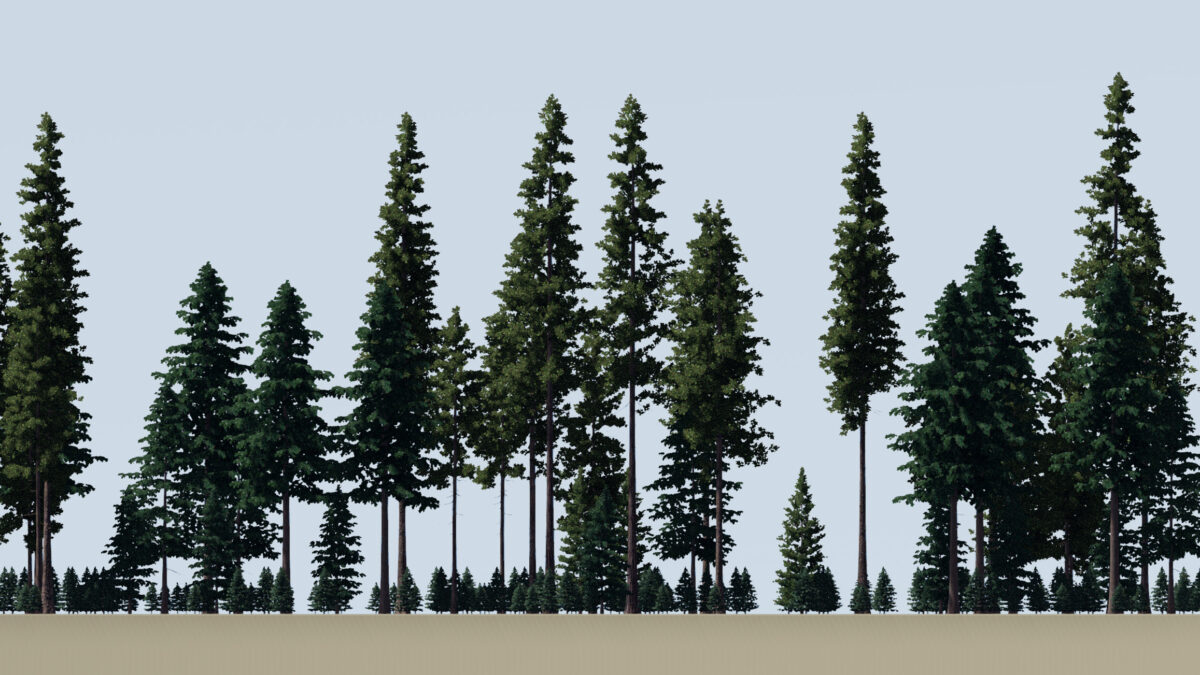
Using the utility above in conjunction with Stand Designer, it is possible to quickly build visualizations of any stand in the Western US that has been measured and recorded in the FIA database. Here are a few examples of other stands from around the west:
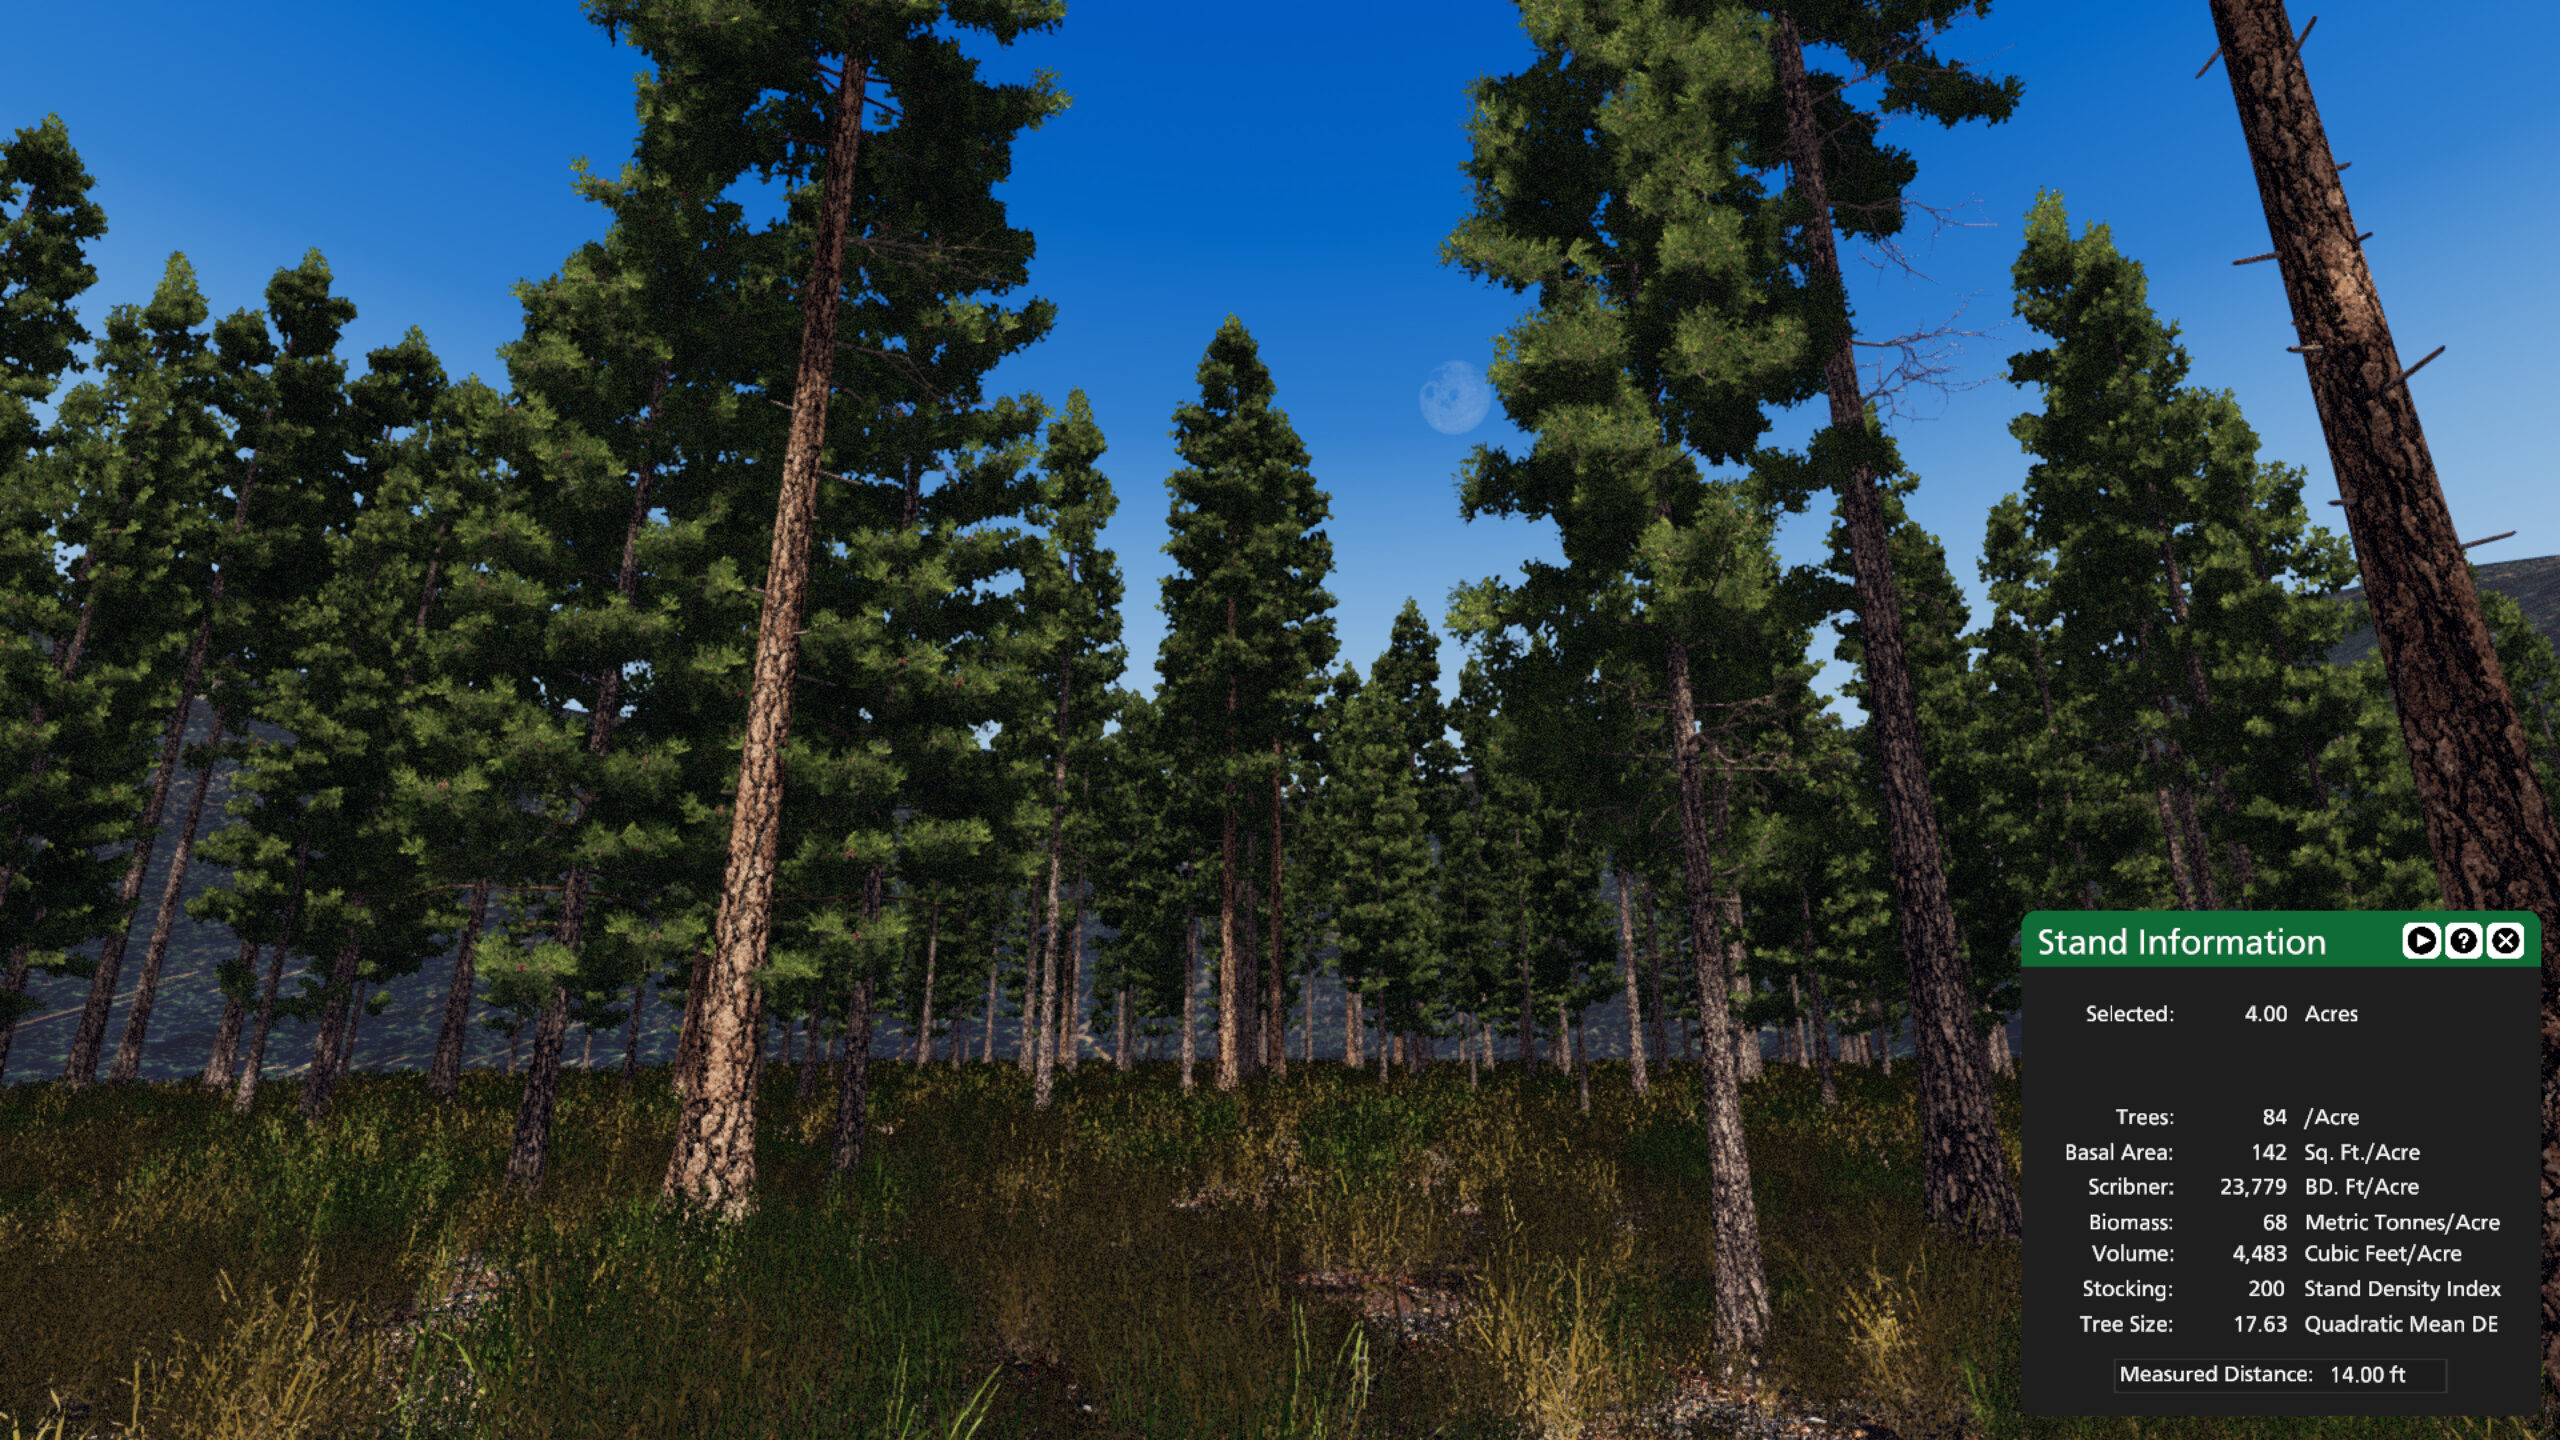
A mature ponderosa pine stand near Flagstaff, AZ
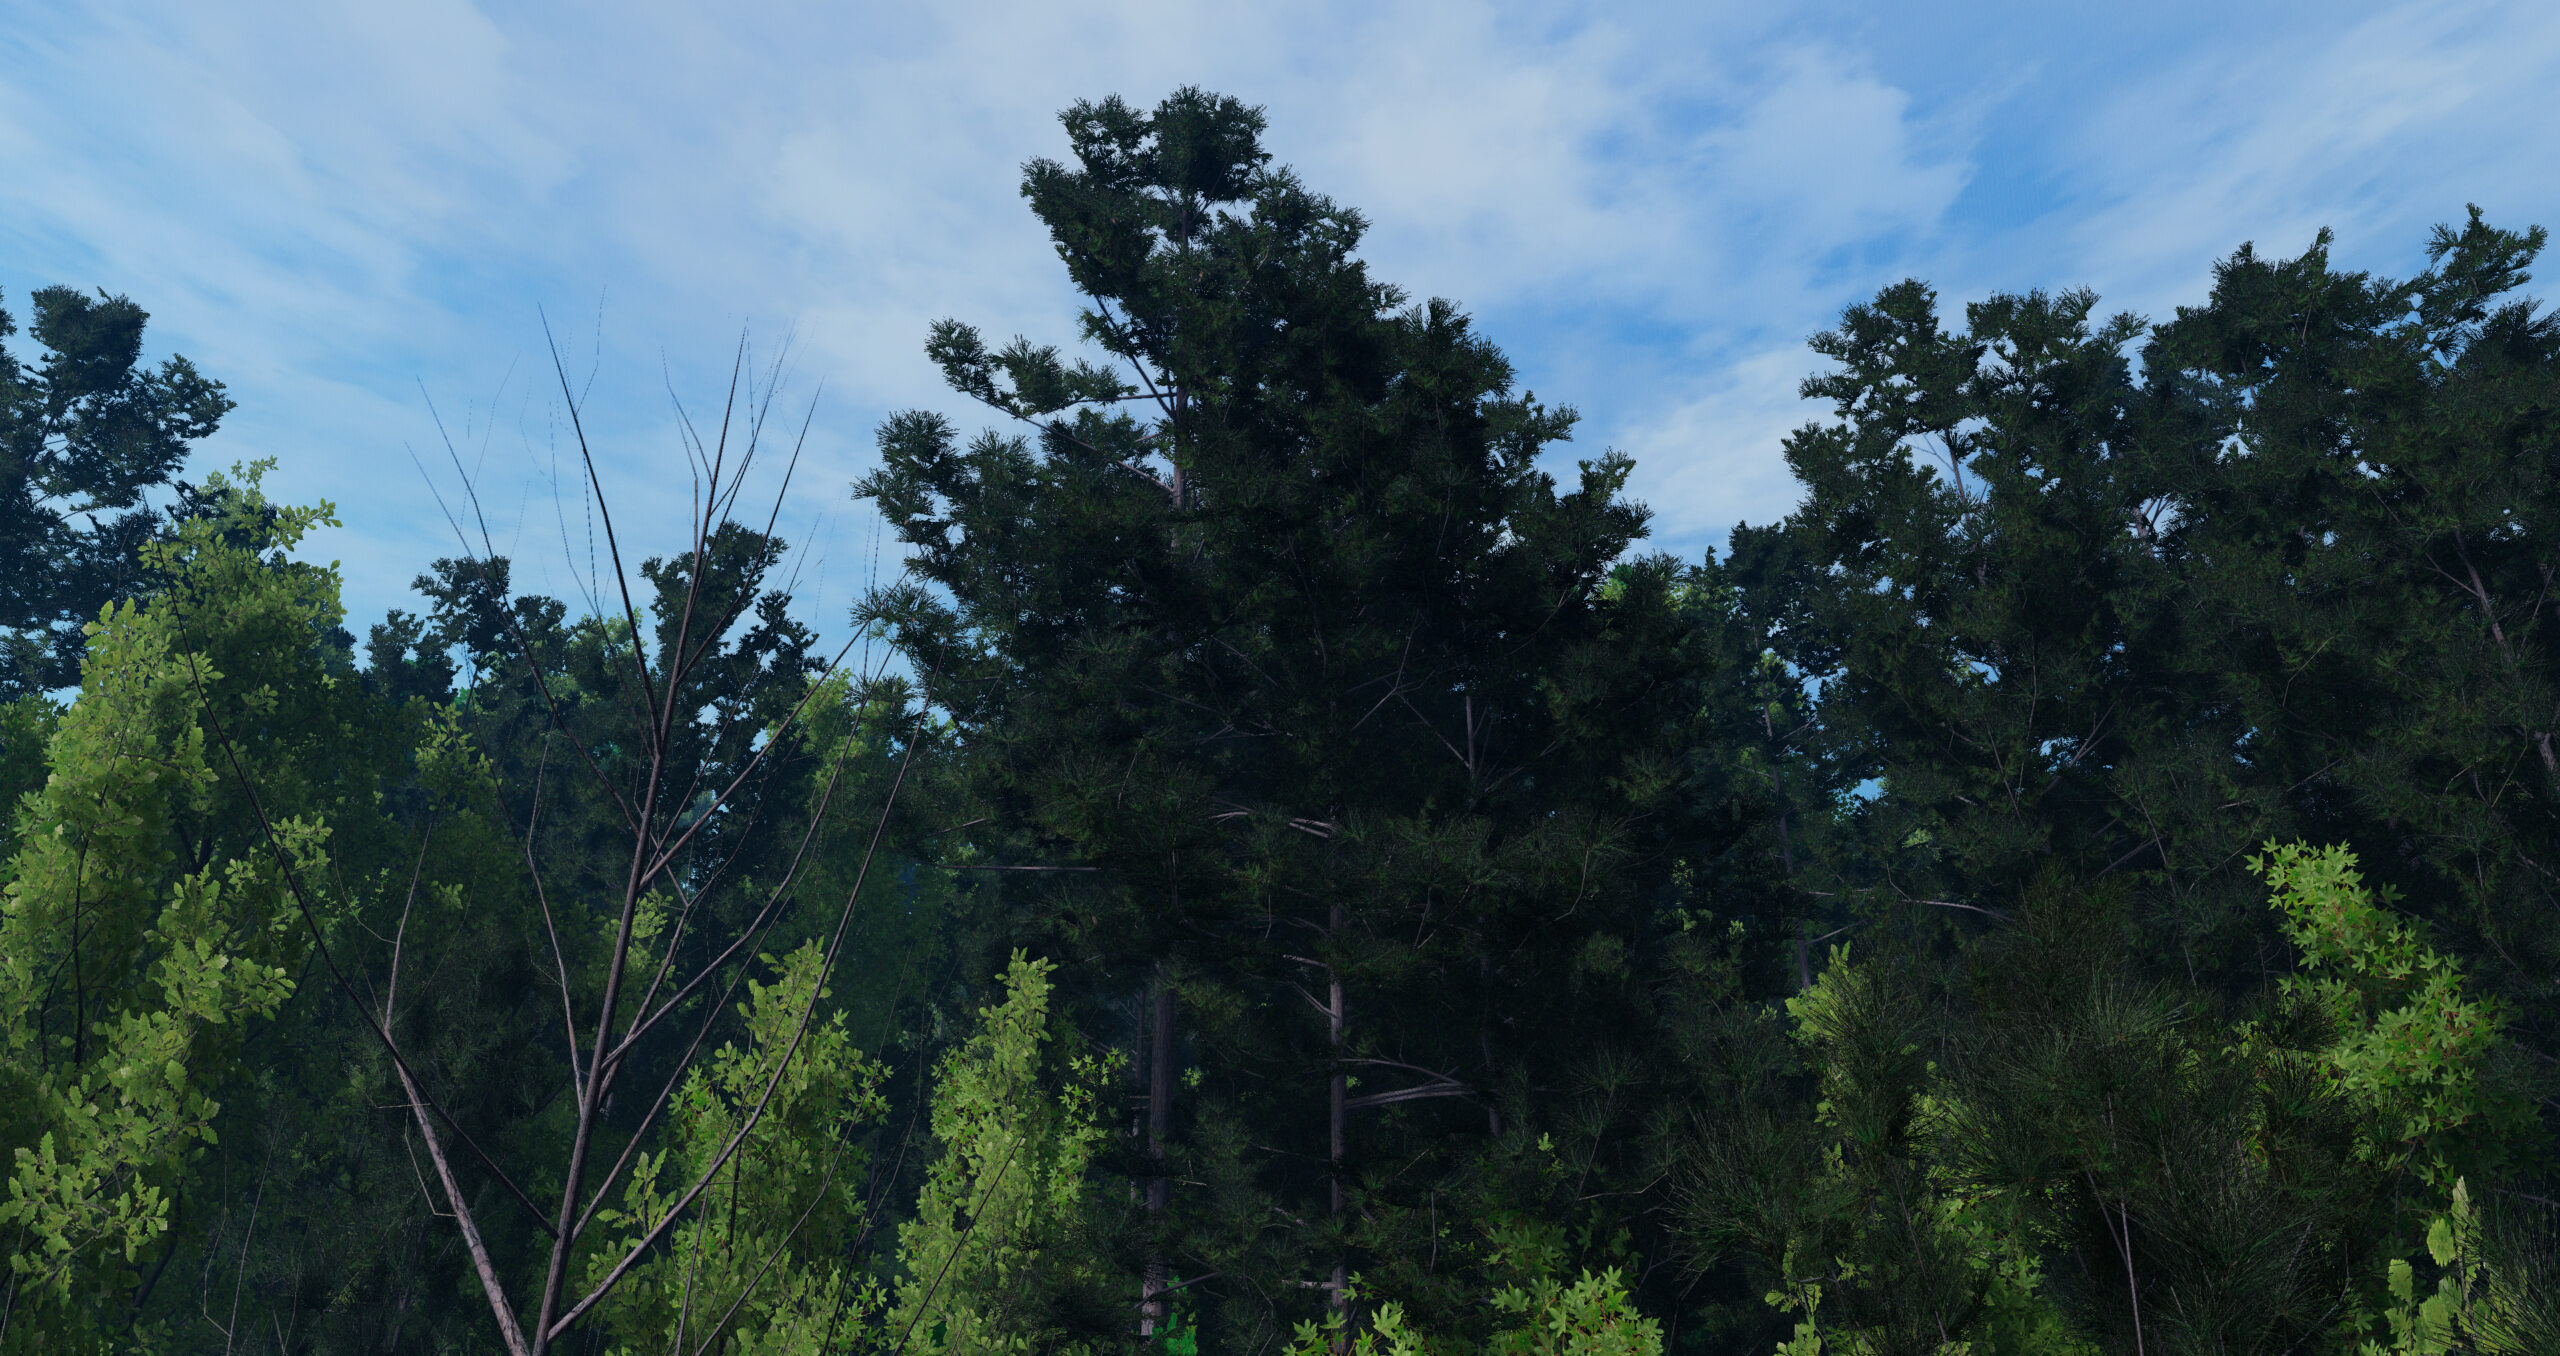
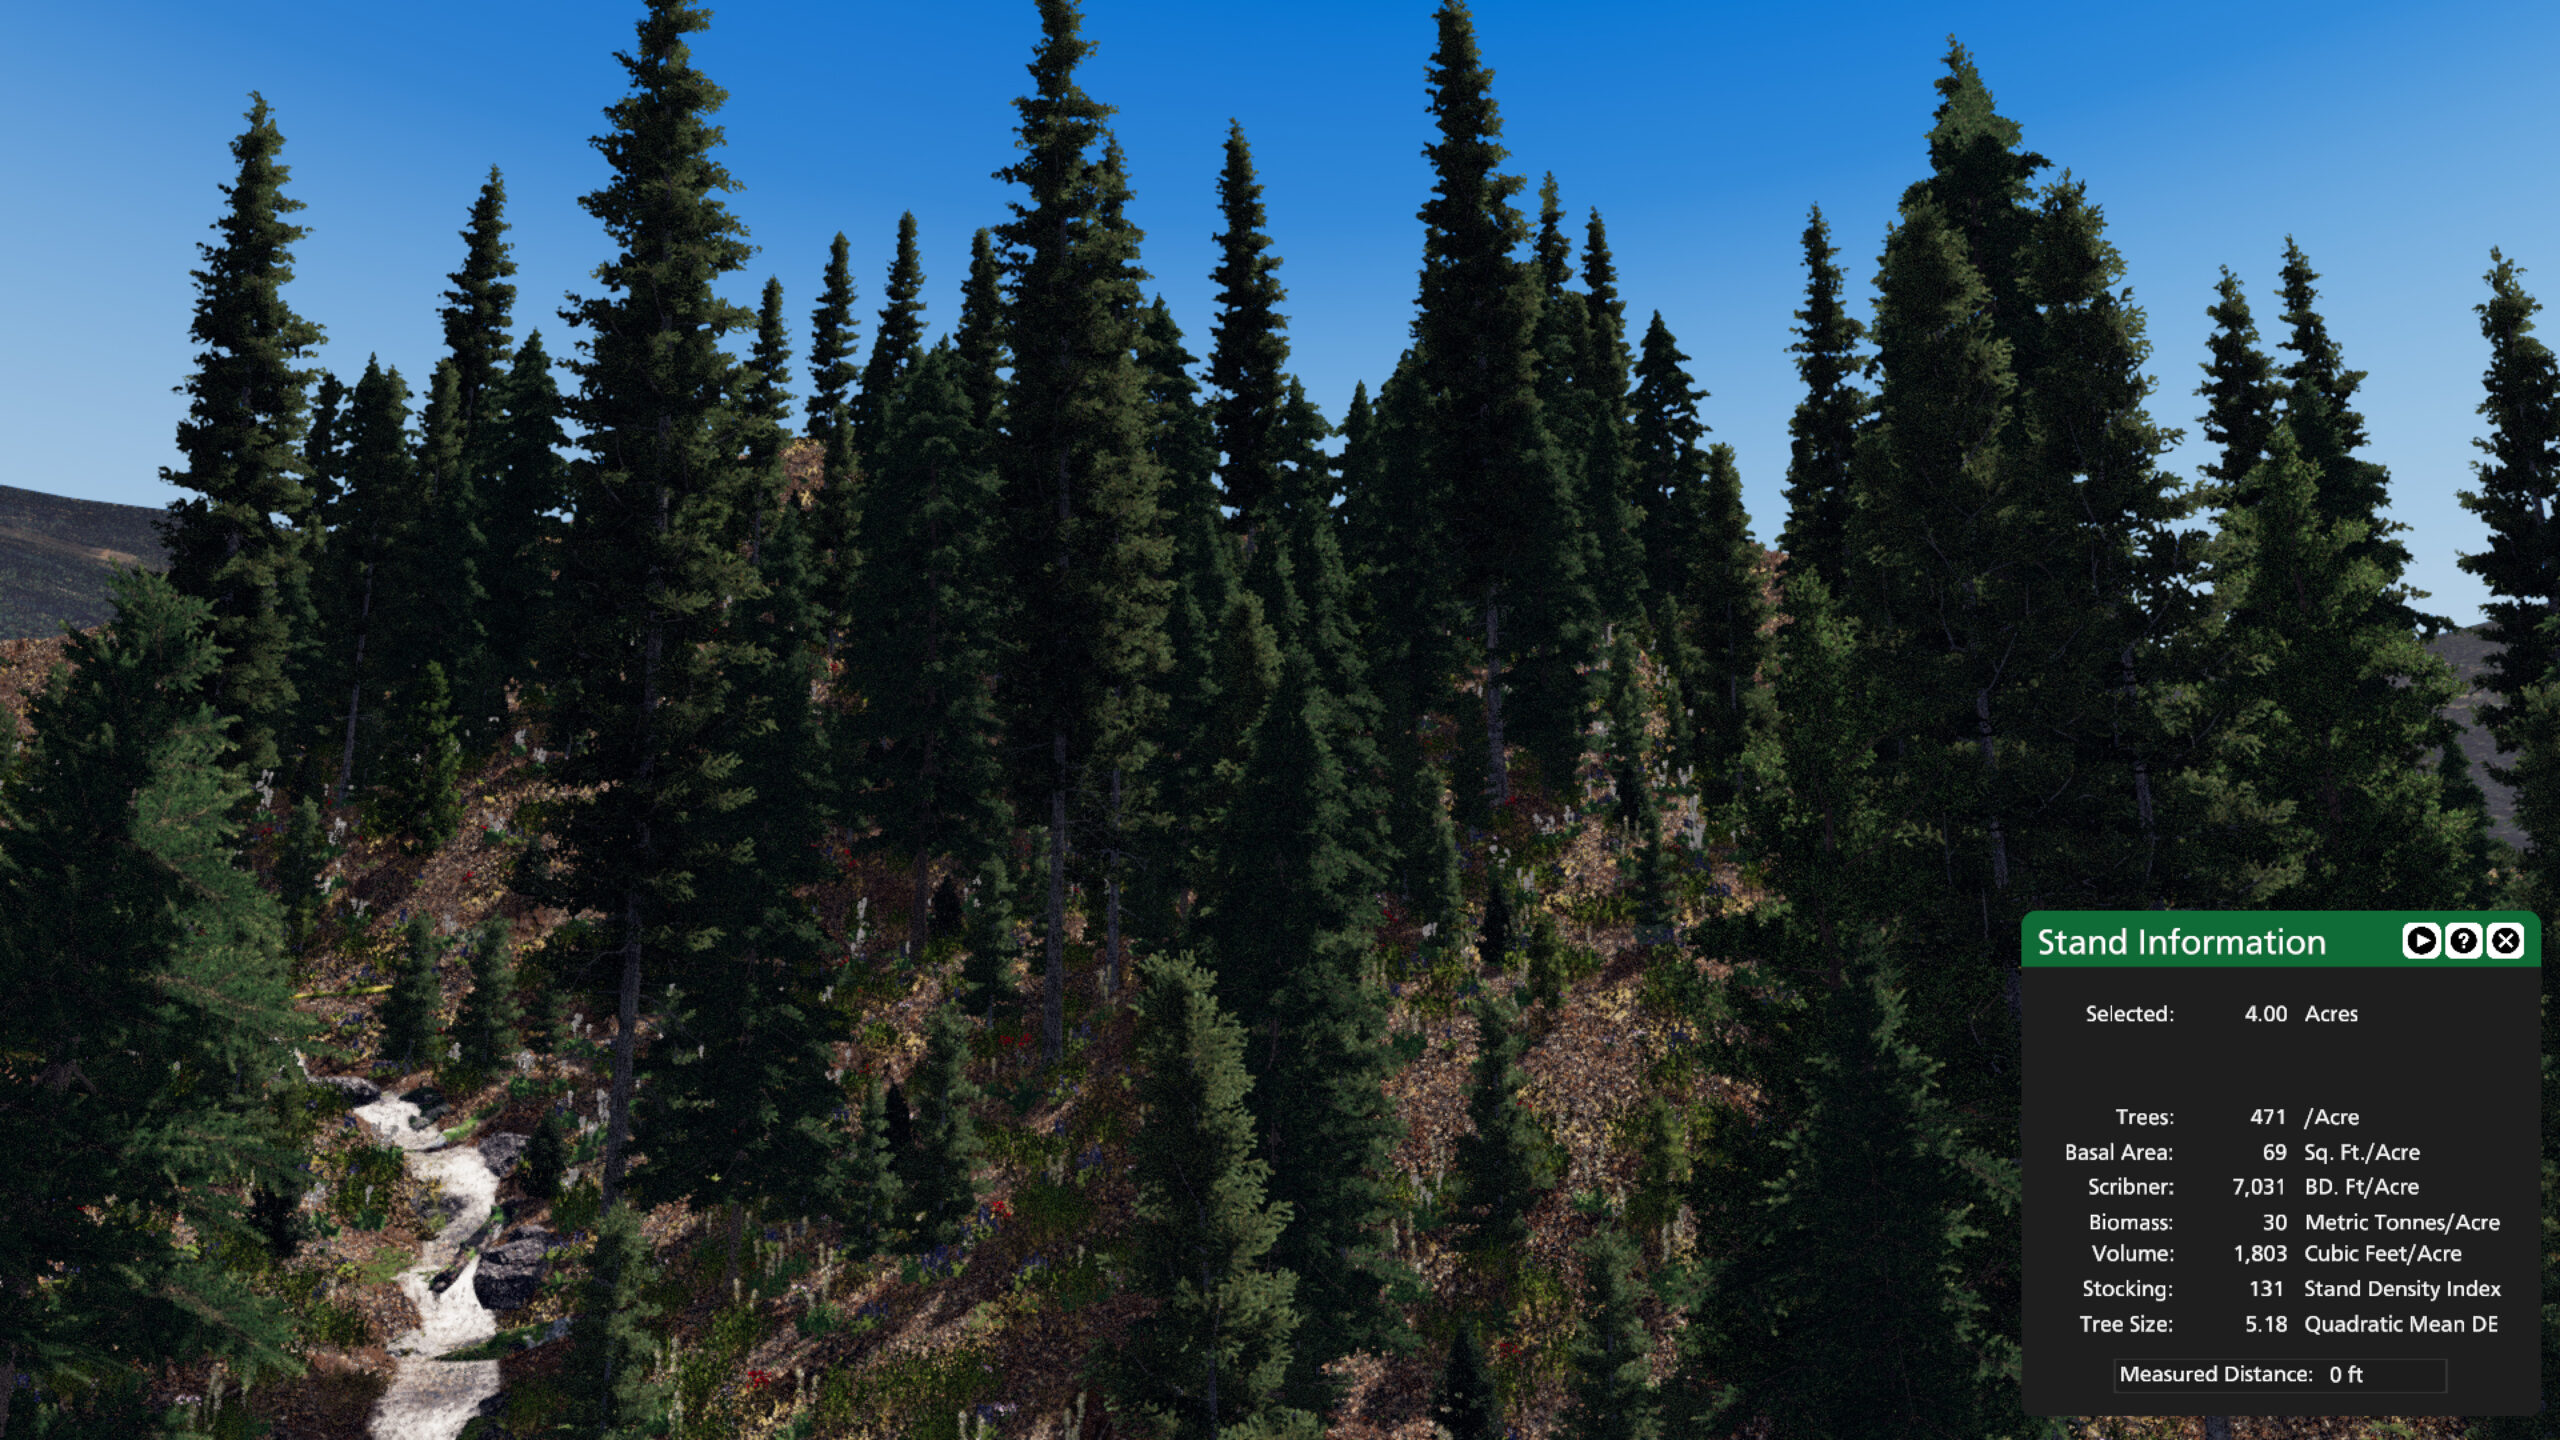
A high elevation spruce-fir stand near Kalispell, MT
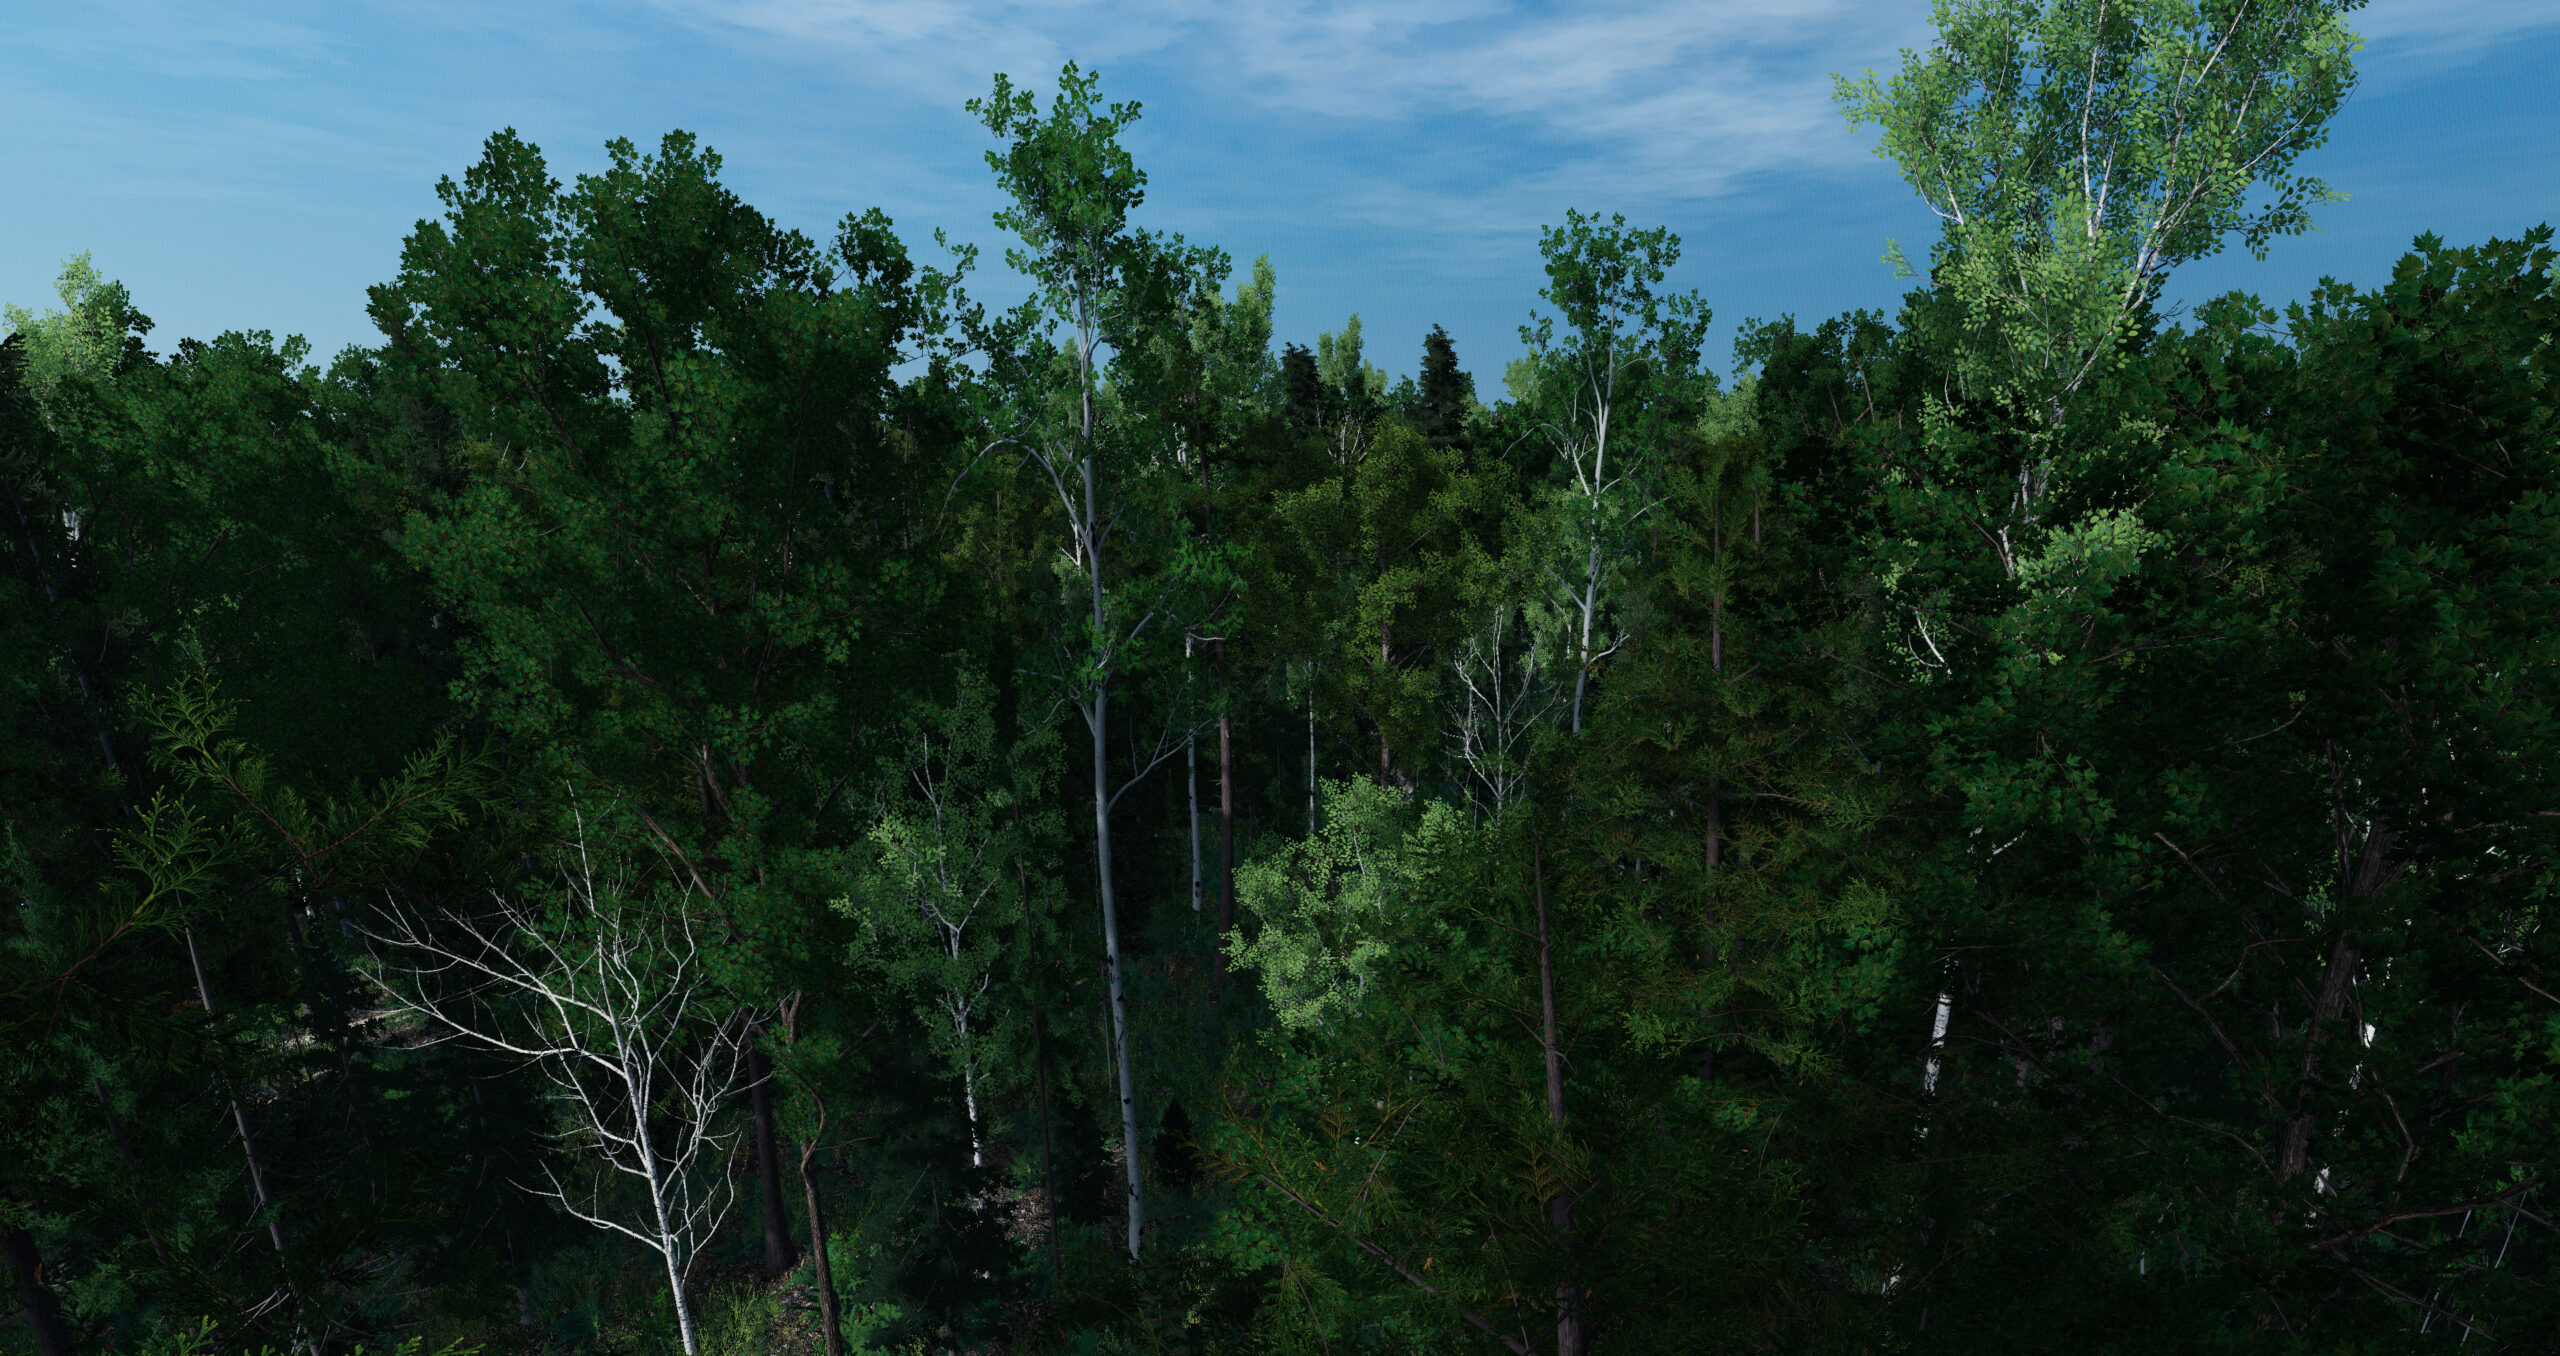
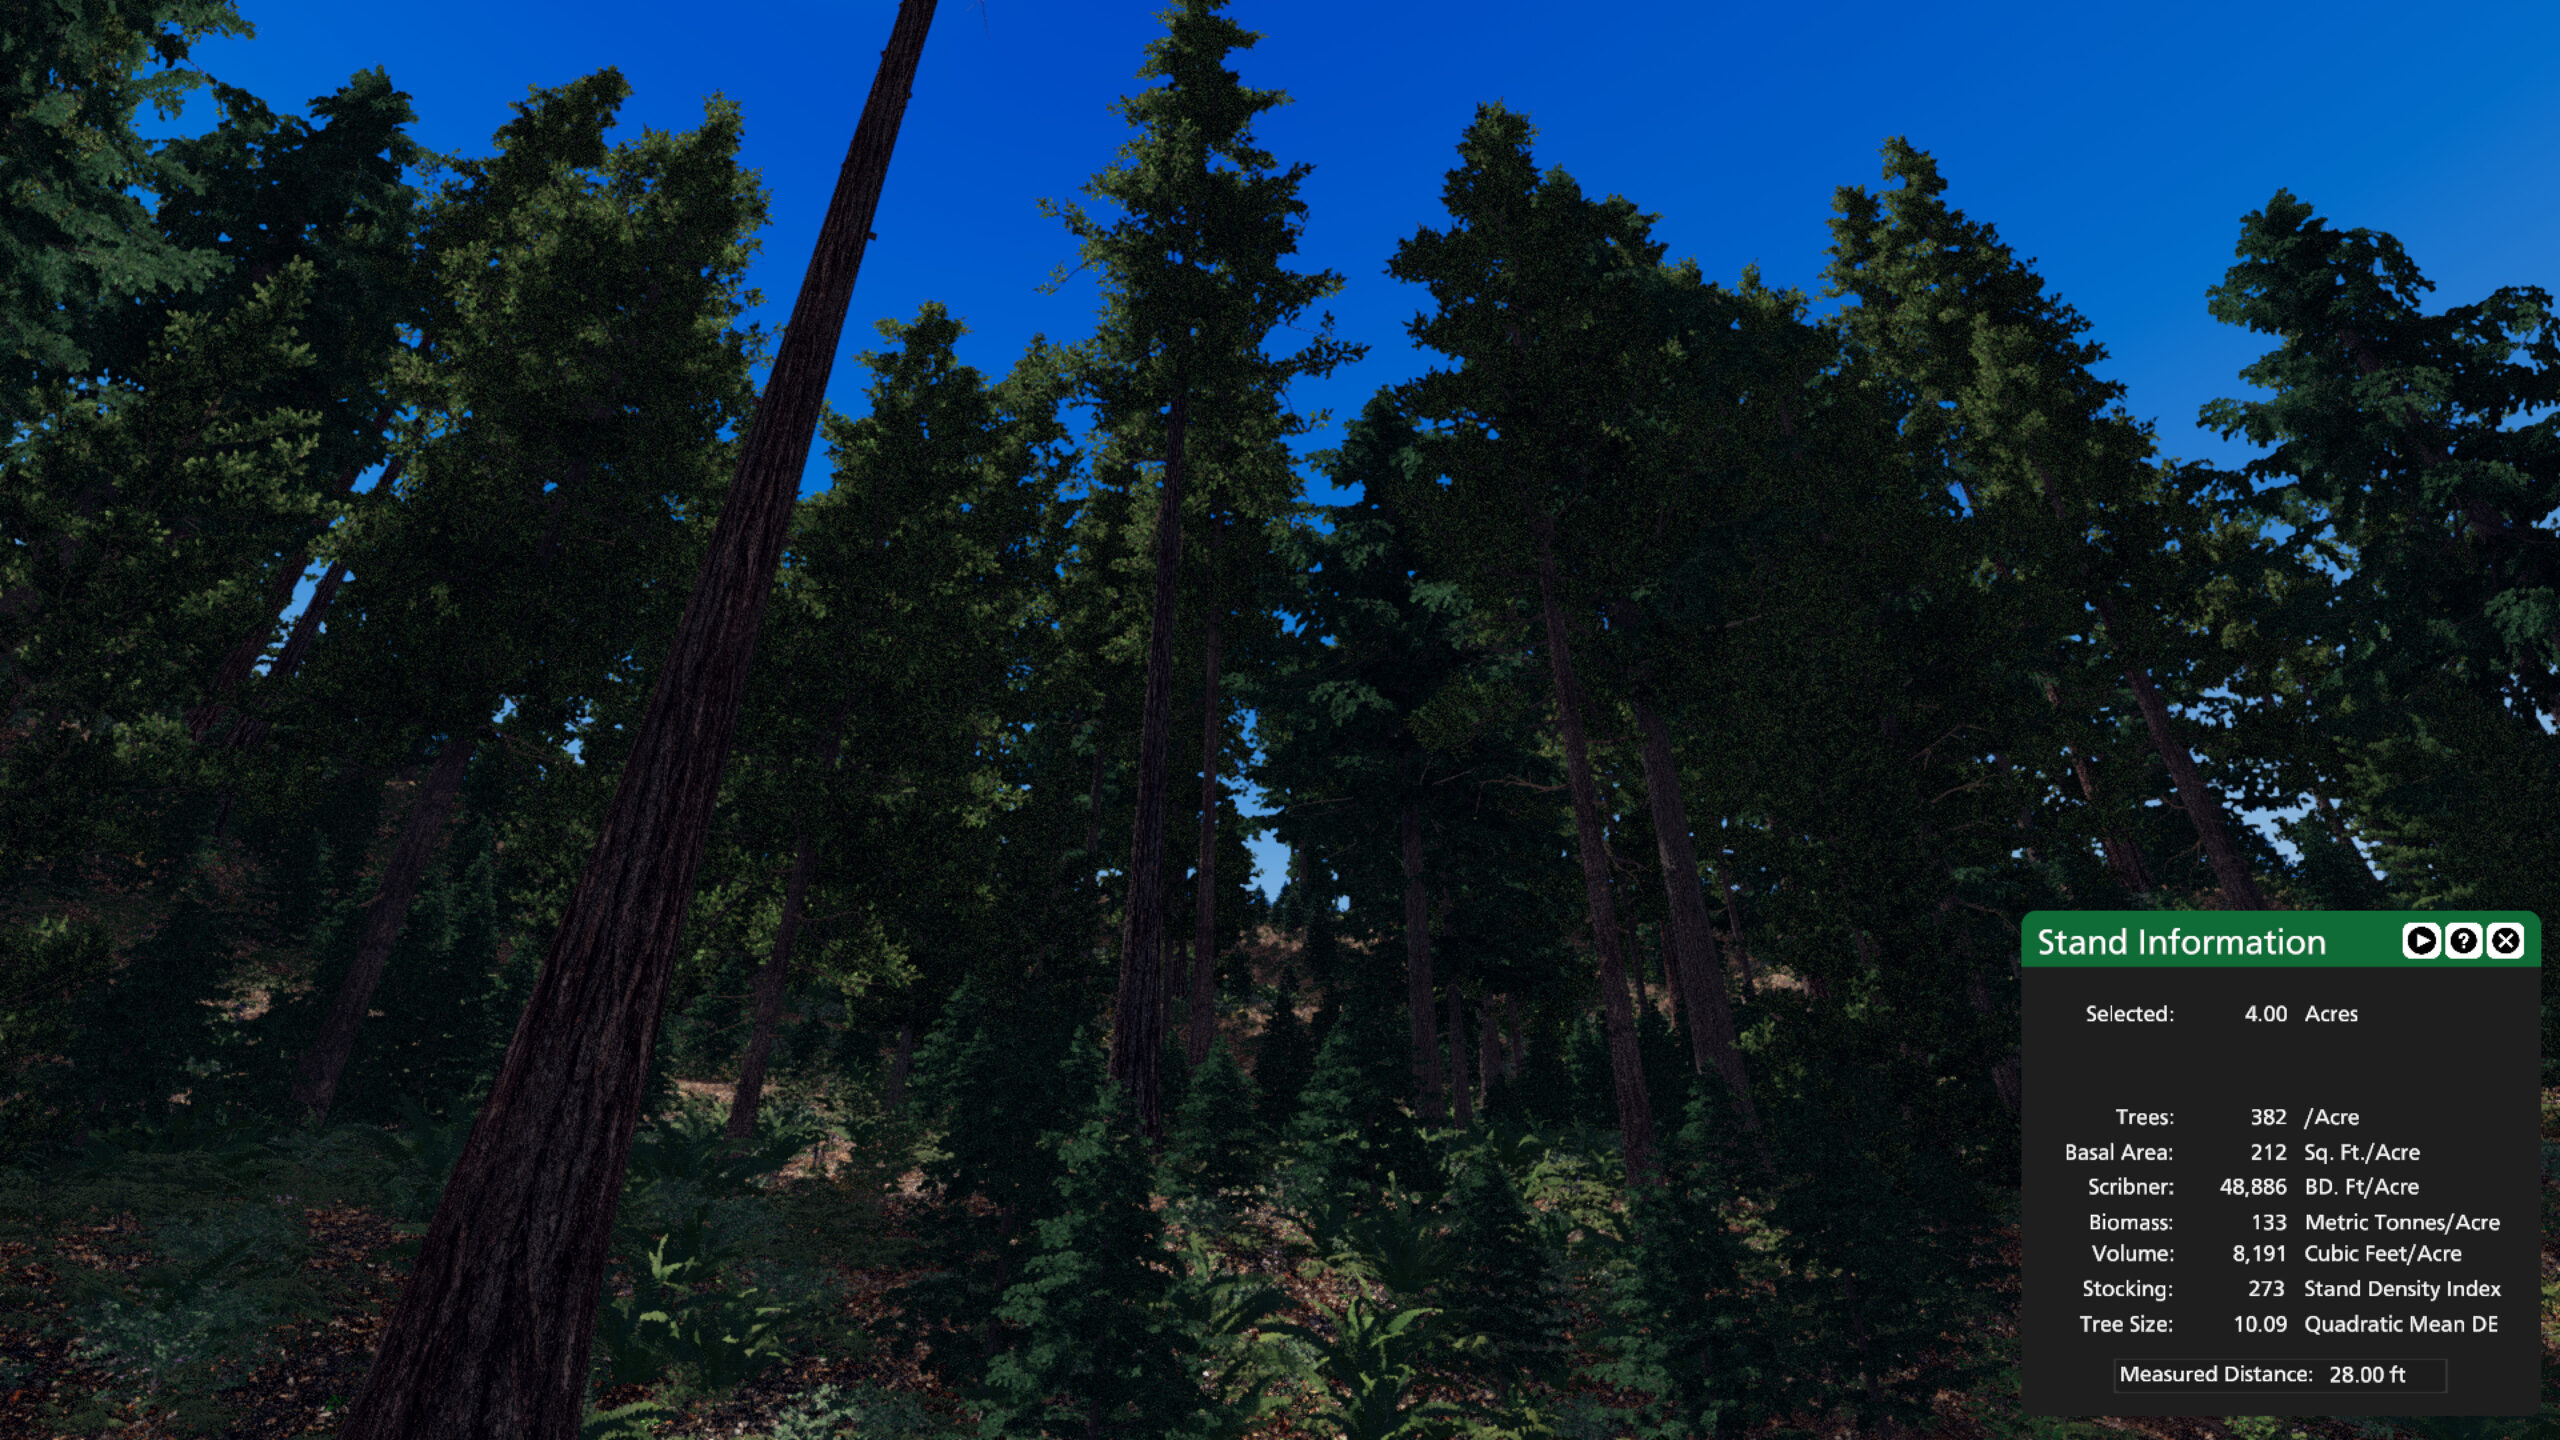
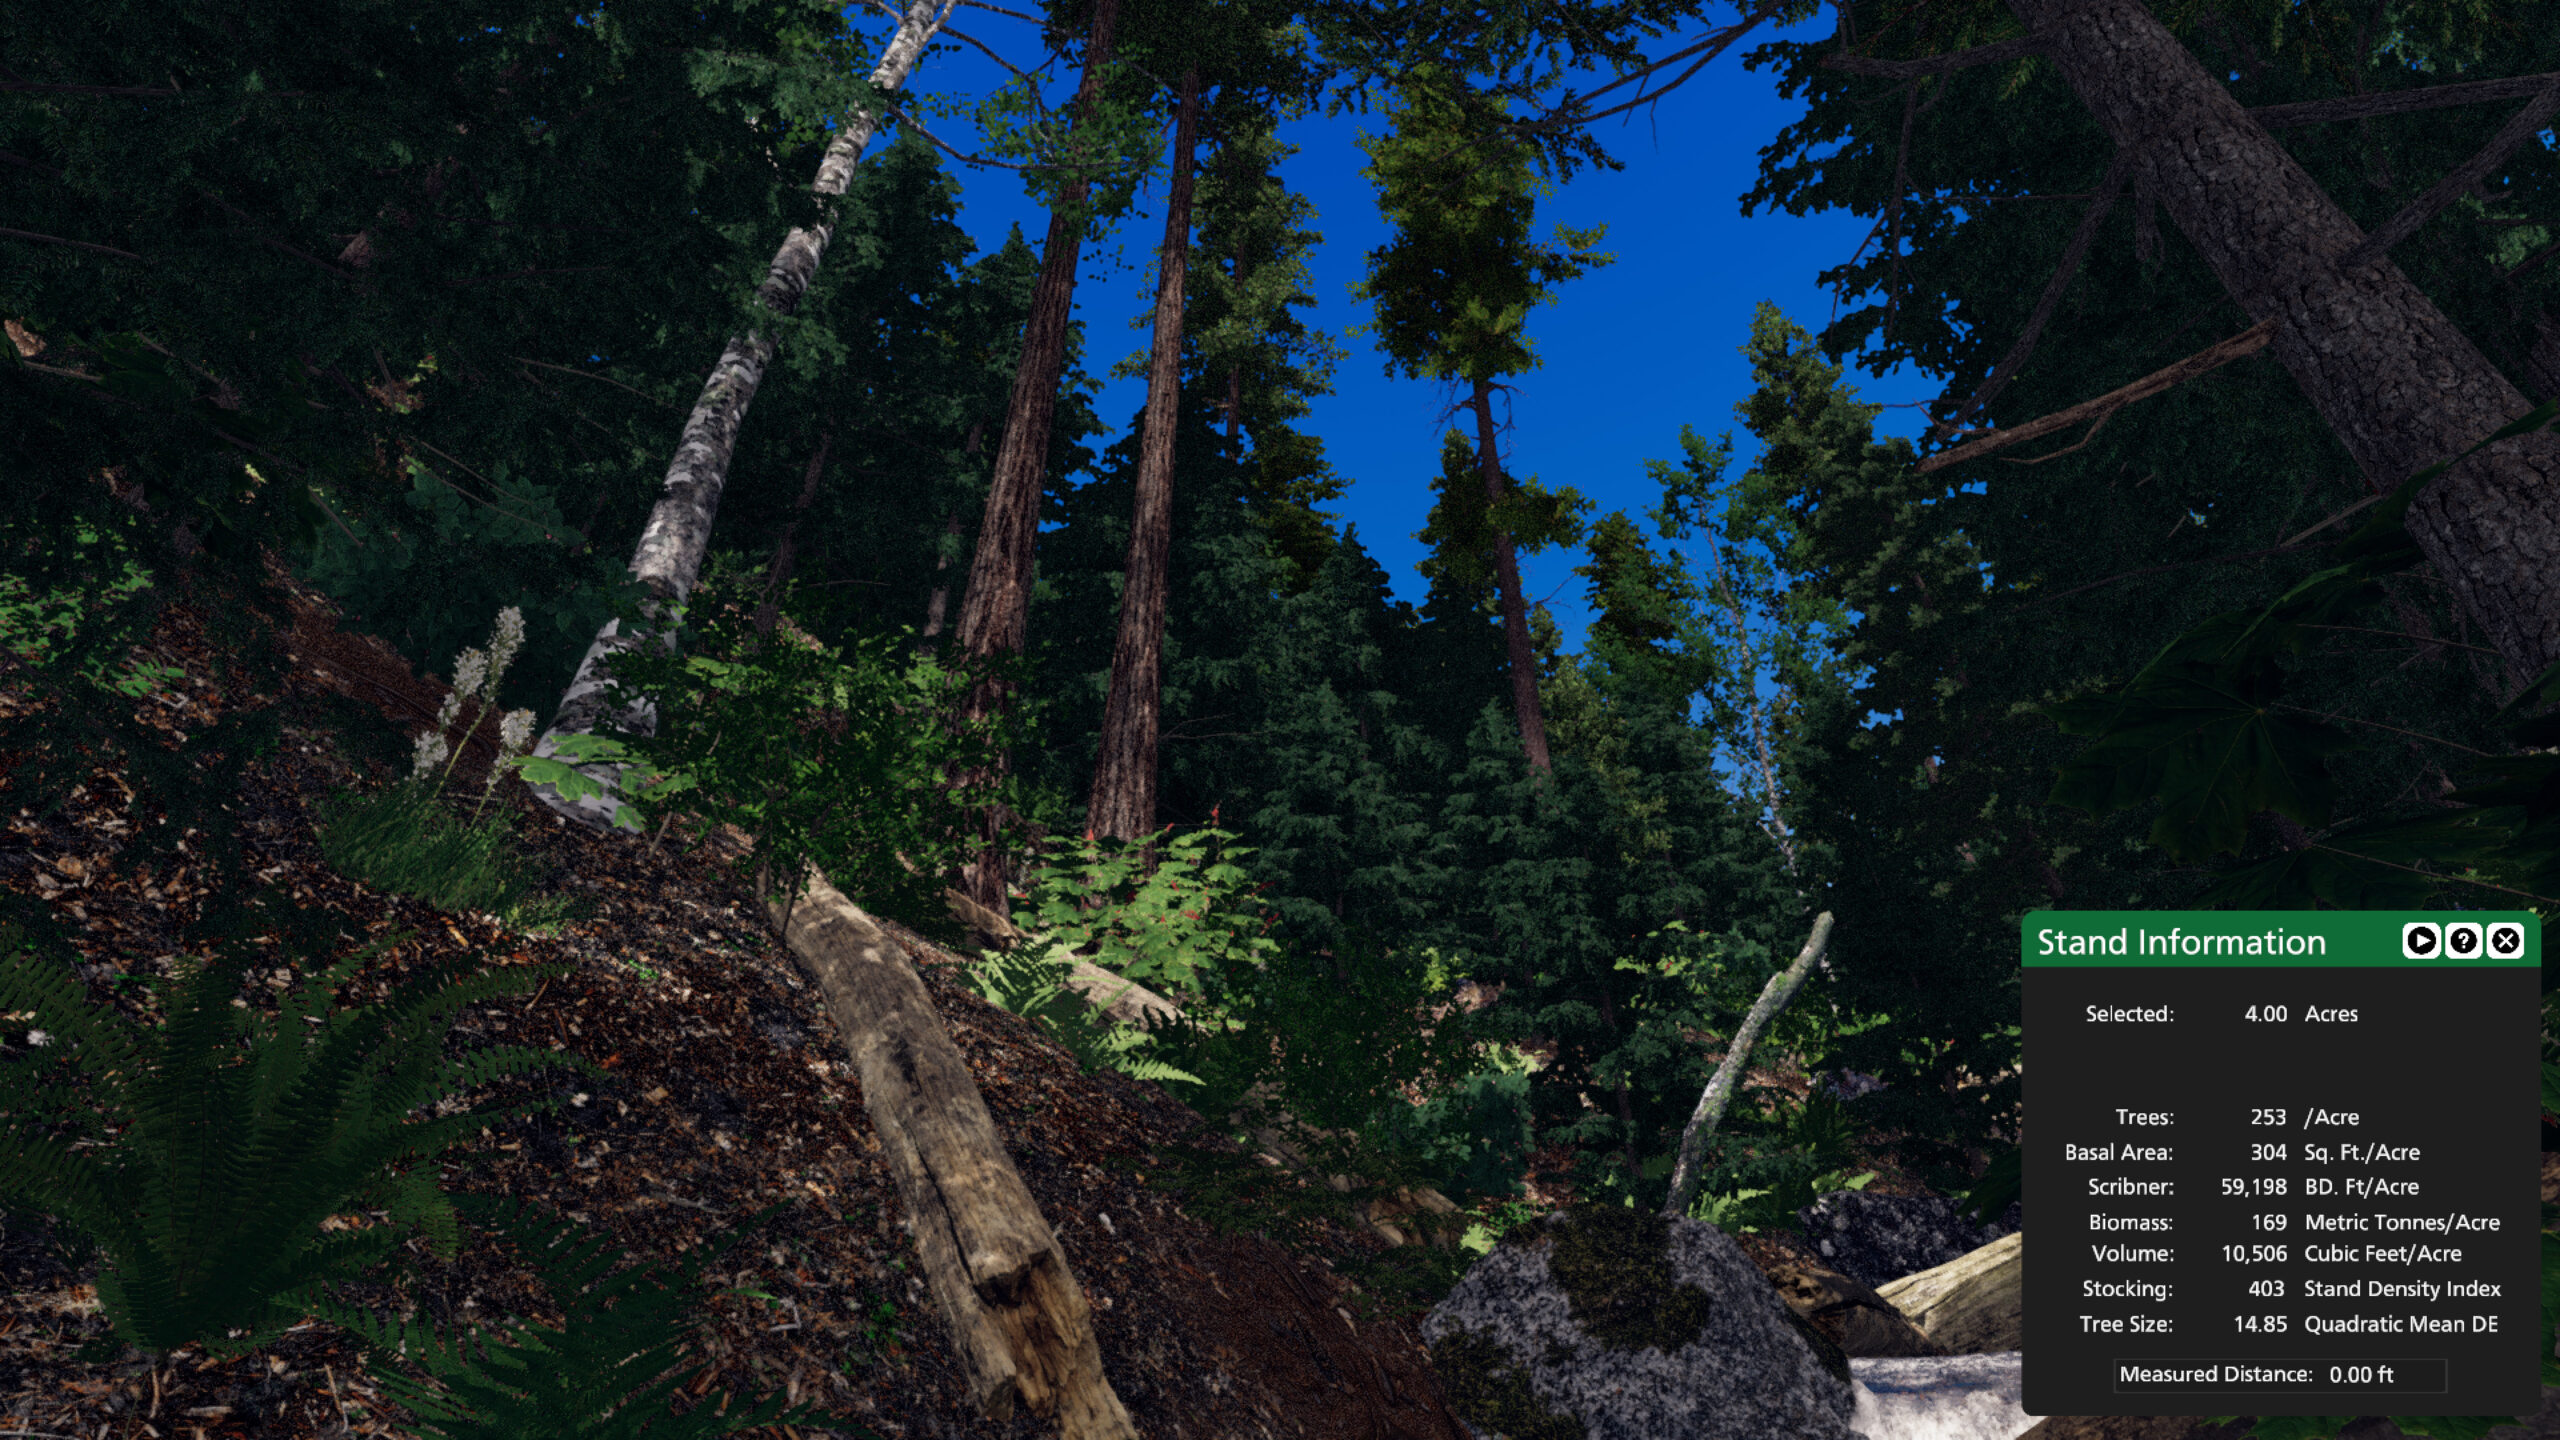
A complex stand near Port Angeles, WA. The overstory is composed of 30+ inch Douglas-fir and western redcedar. The understory is composed of western hemlock, grand fir, and red alder.
We encourage you to explore this massive source of data and build your own visualizations. Try exploring a new region or see if you can learn something new about an area that you know well. Let us know what you discover or what you could teach using this approach, we would love to hear from you.