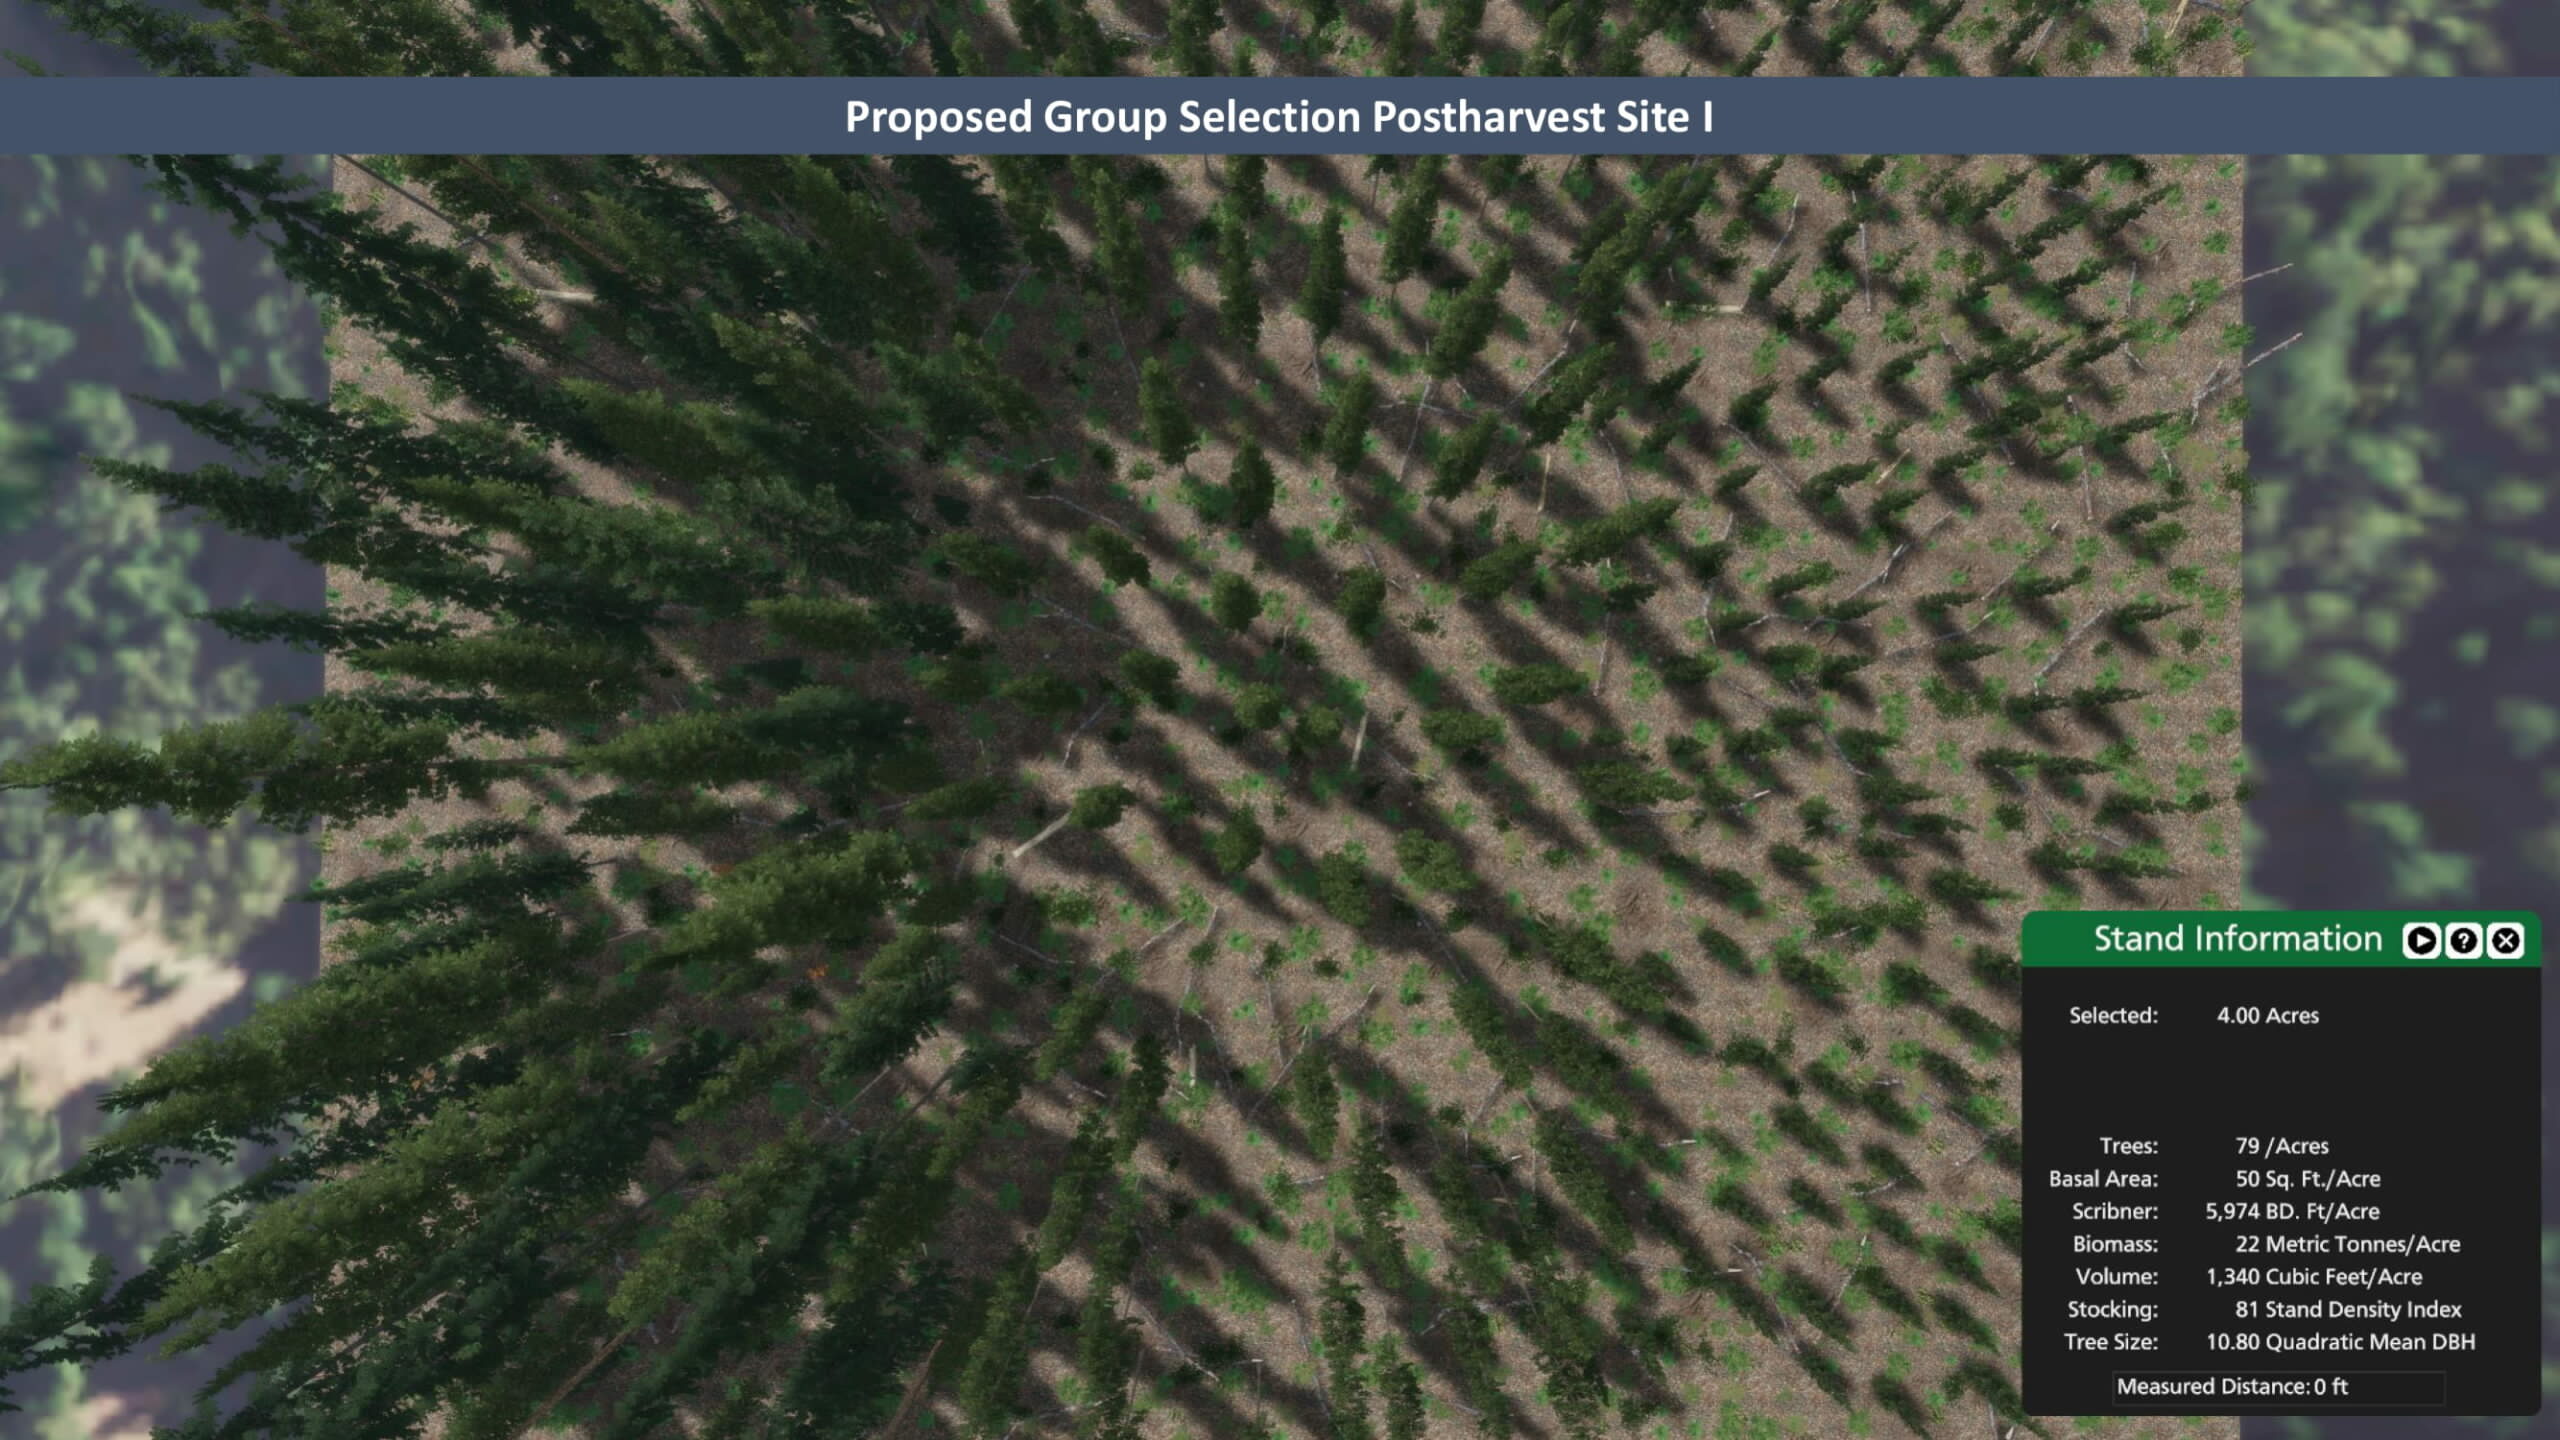
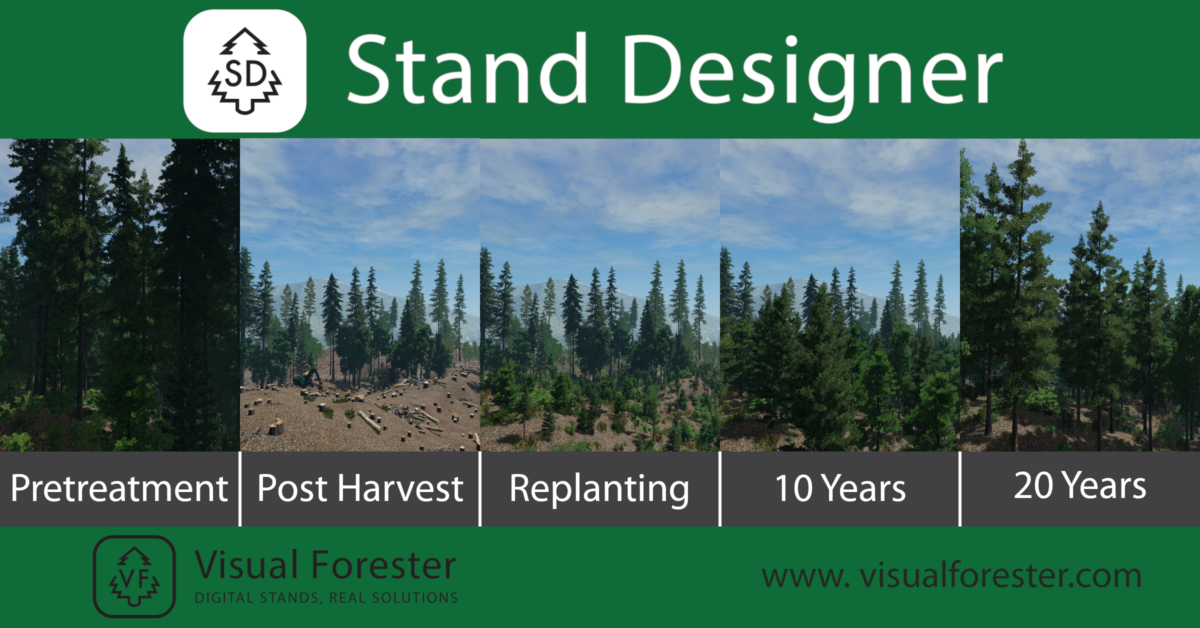
A power point presentation on proposed rule changse for Group Selection Silviculture in California submitted to us by Adam Deem. This is an excellent example of Stand Designer being used to show proposed plans in an easy-to-understand way.

A power point presentation on proposed rule changse for Group Selection Silviculture in California submitted to us by Adam Deem. This is an excellent example of Stand Designer being used to show proposed plans in an easy-to-understand way.

Structures are split by species: Hickory, Maple, and Beech. Approximate Conifers show Balsam Fir, Spruce and White Pine.
VF File Link: https://api.visualforester.com/wp-content/uploads/gravity_forms/7-cce81bd0458445928d646ae97bcbf706/2022/11/Adirondacks-1.vl
Image 1: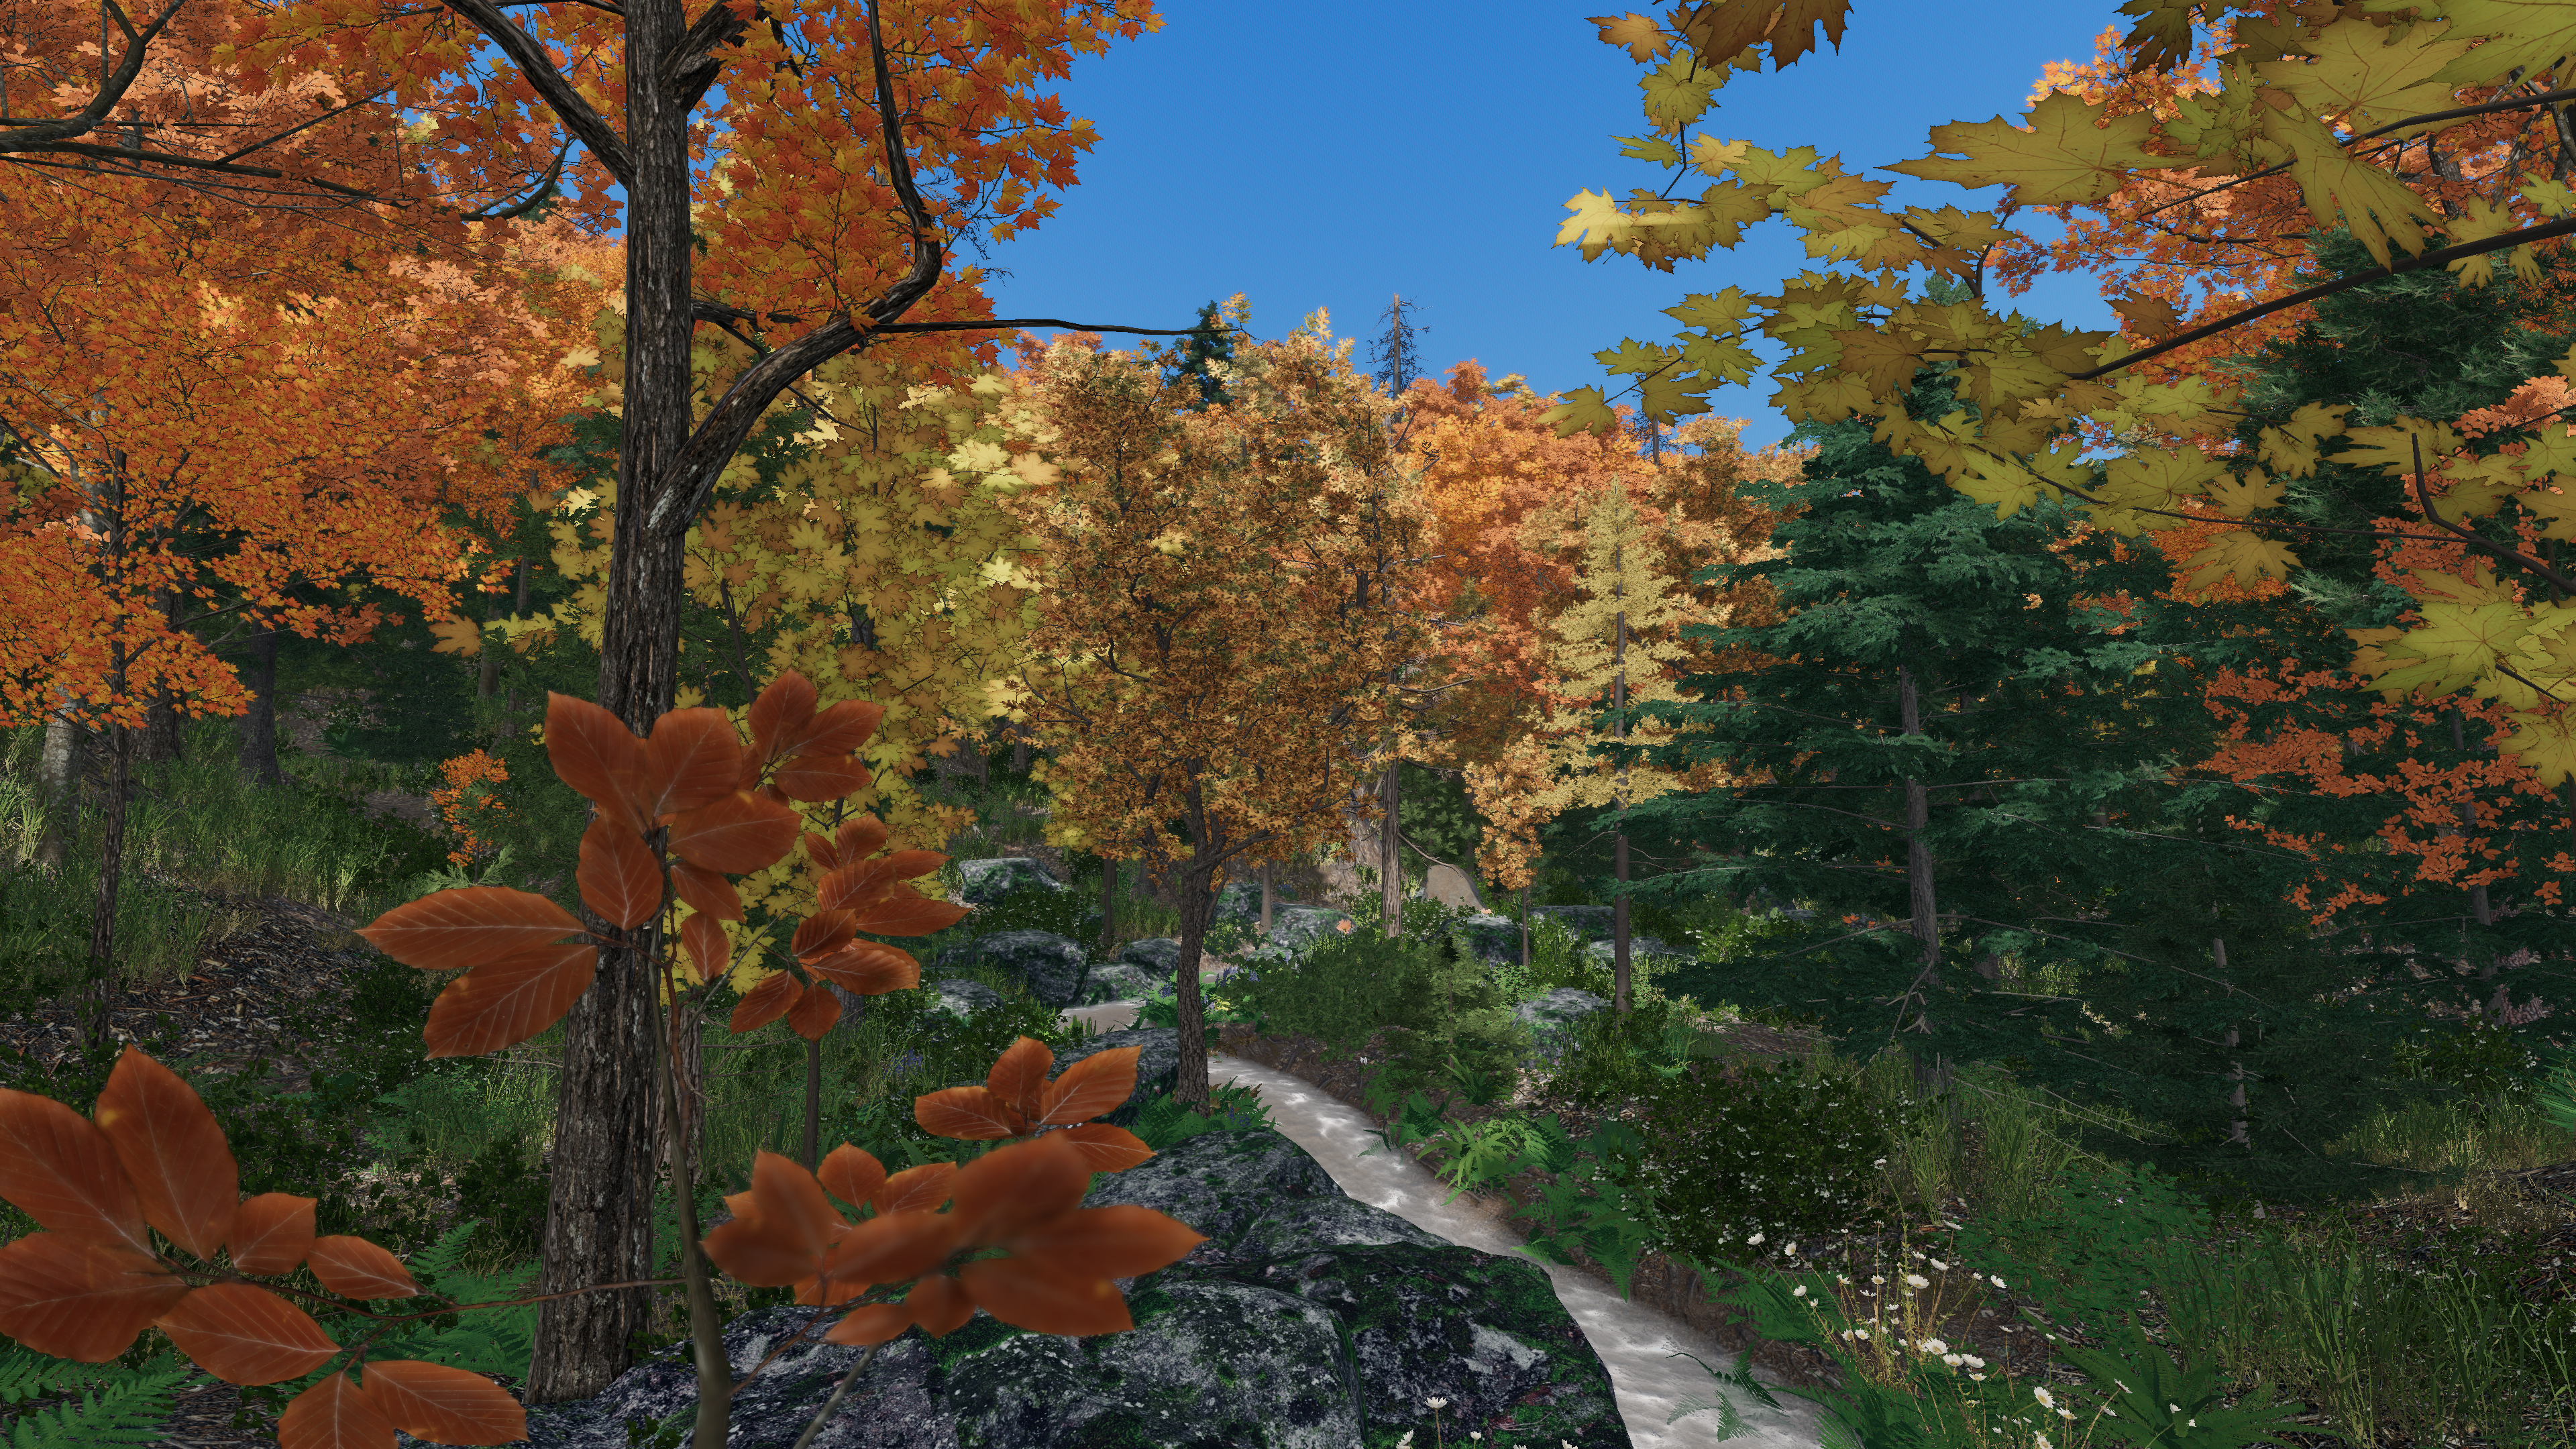
Image 2: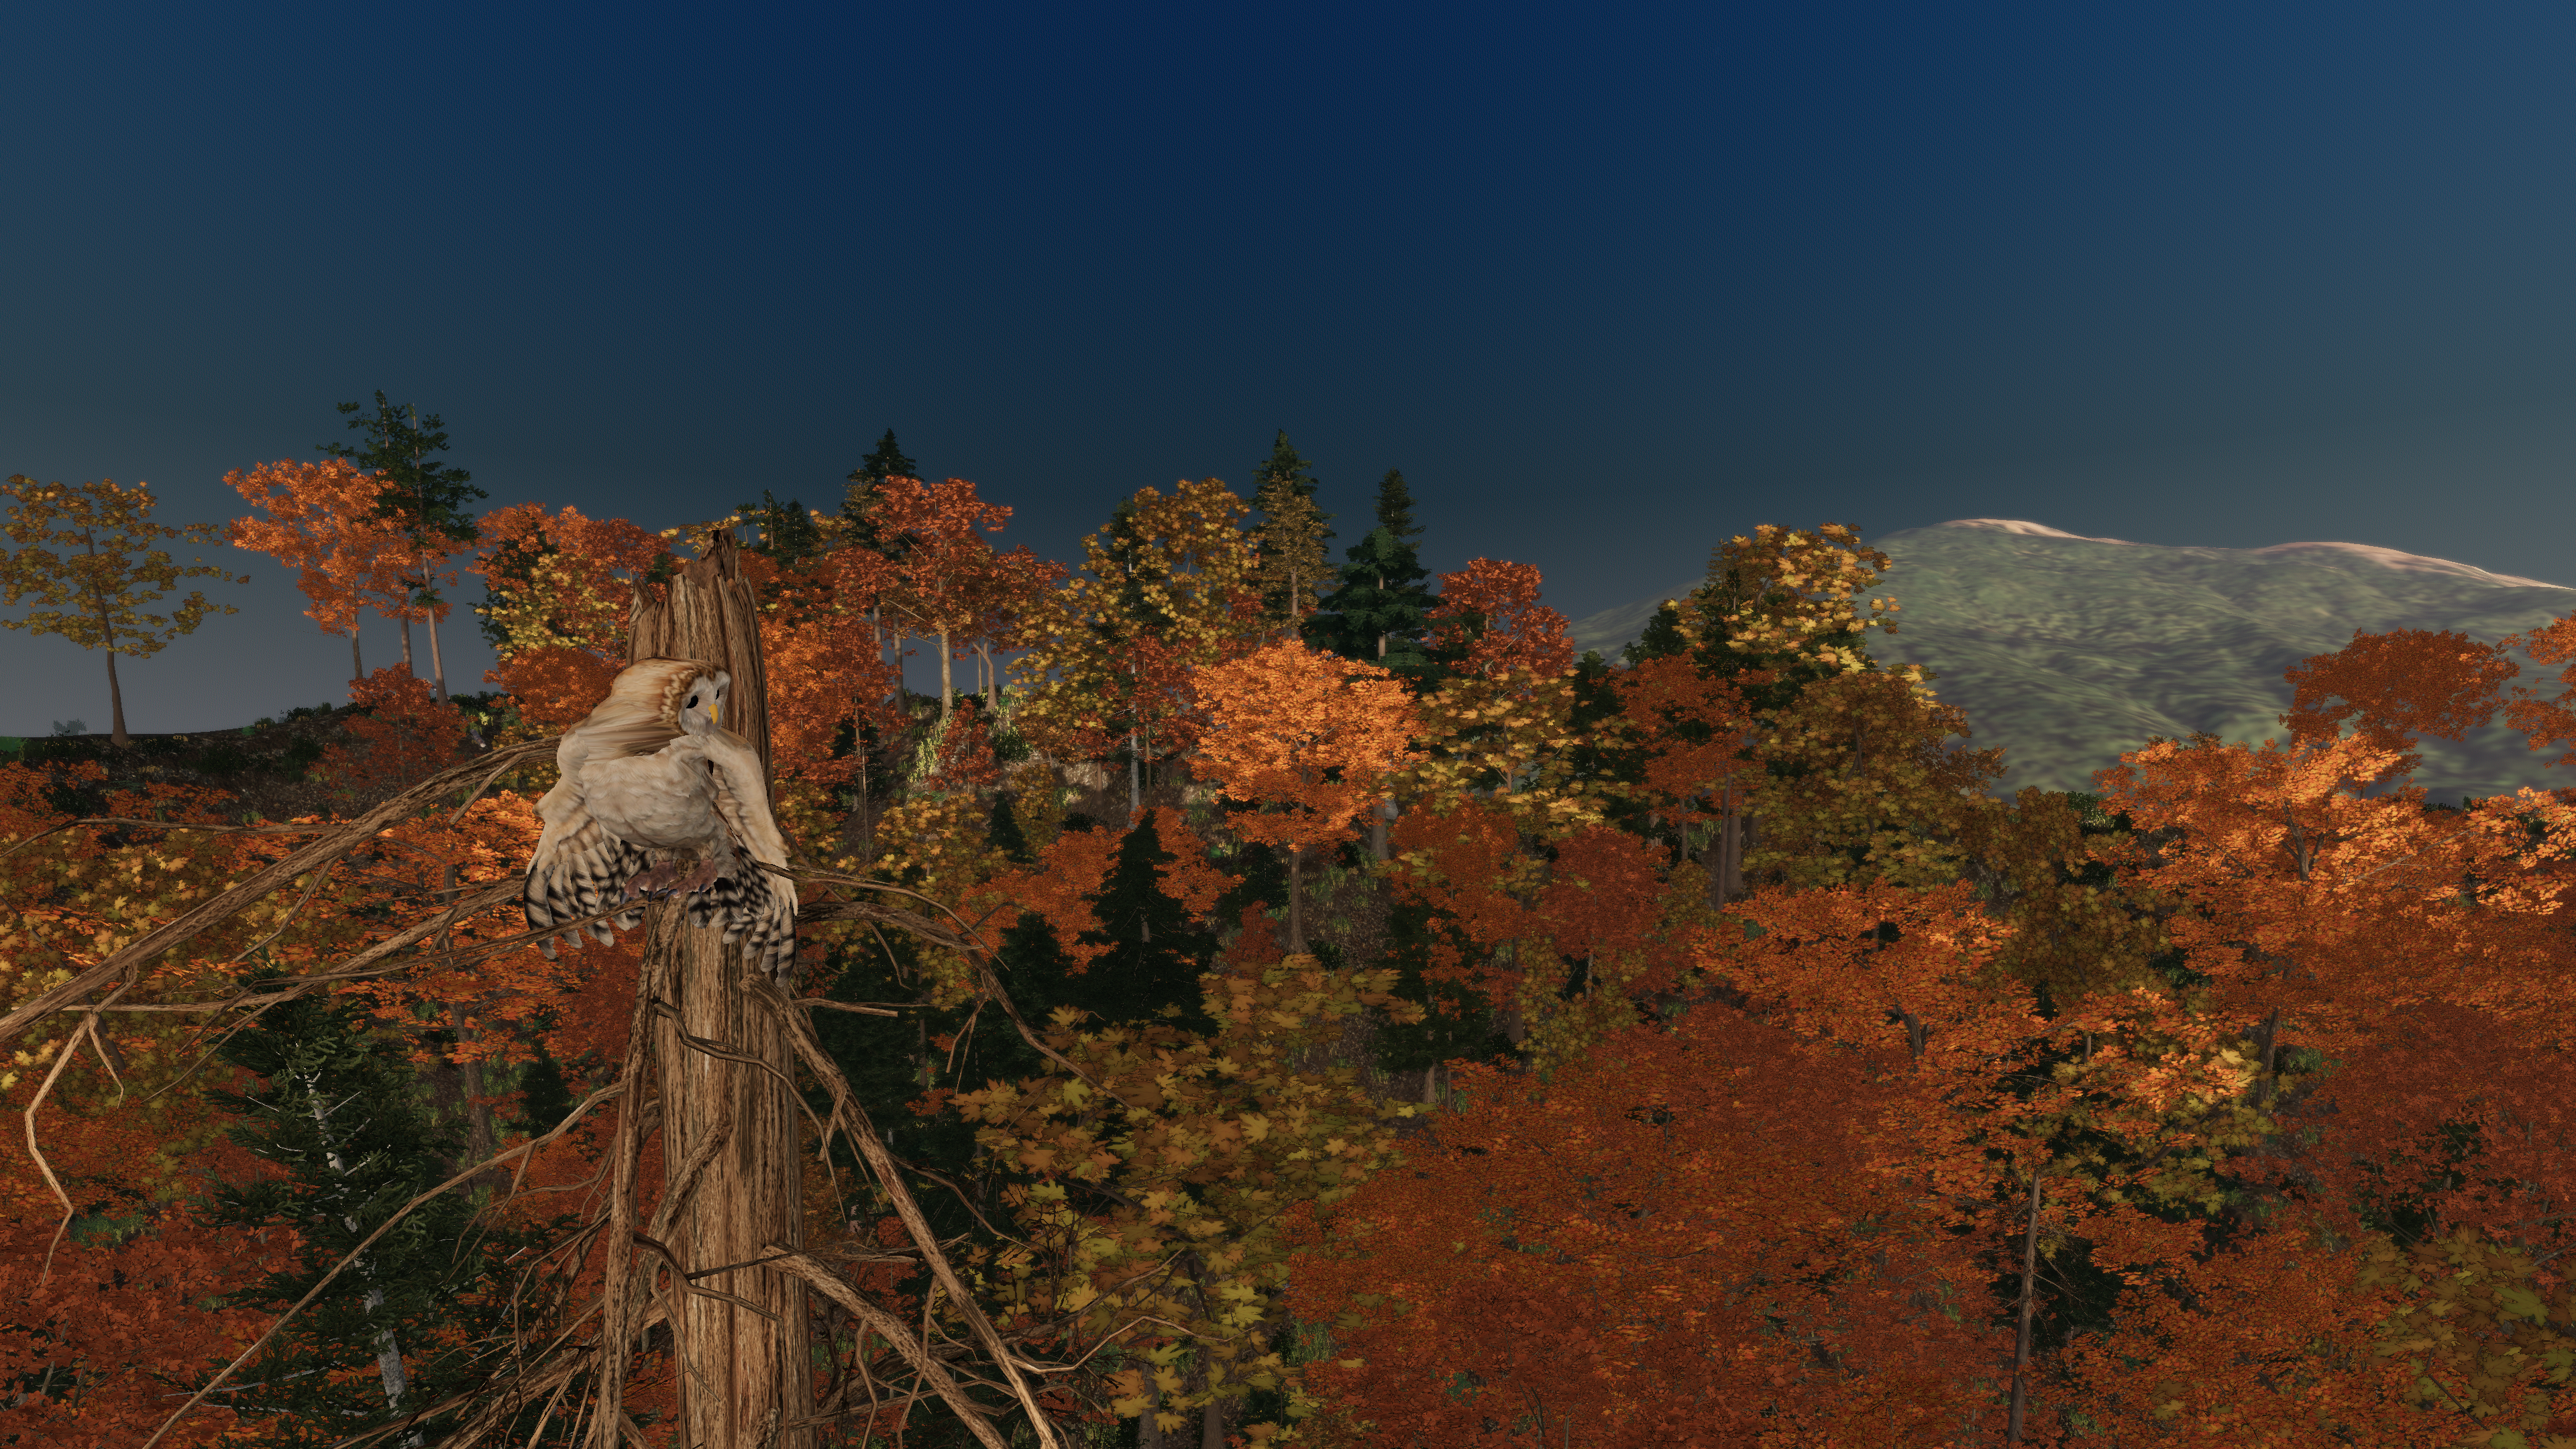
by: Nic Bruno

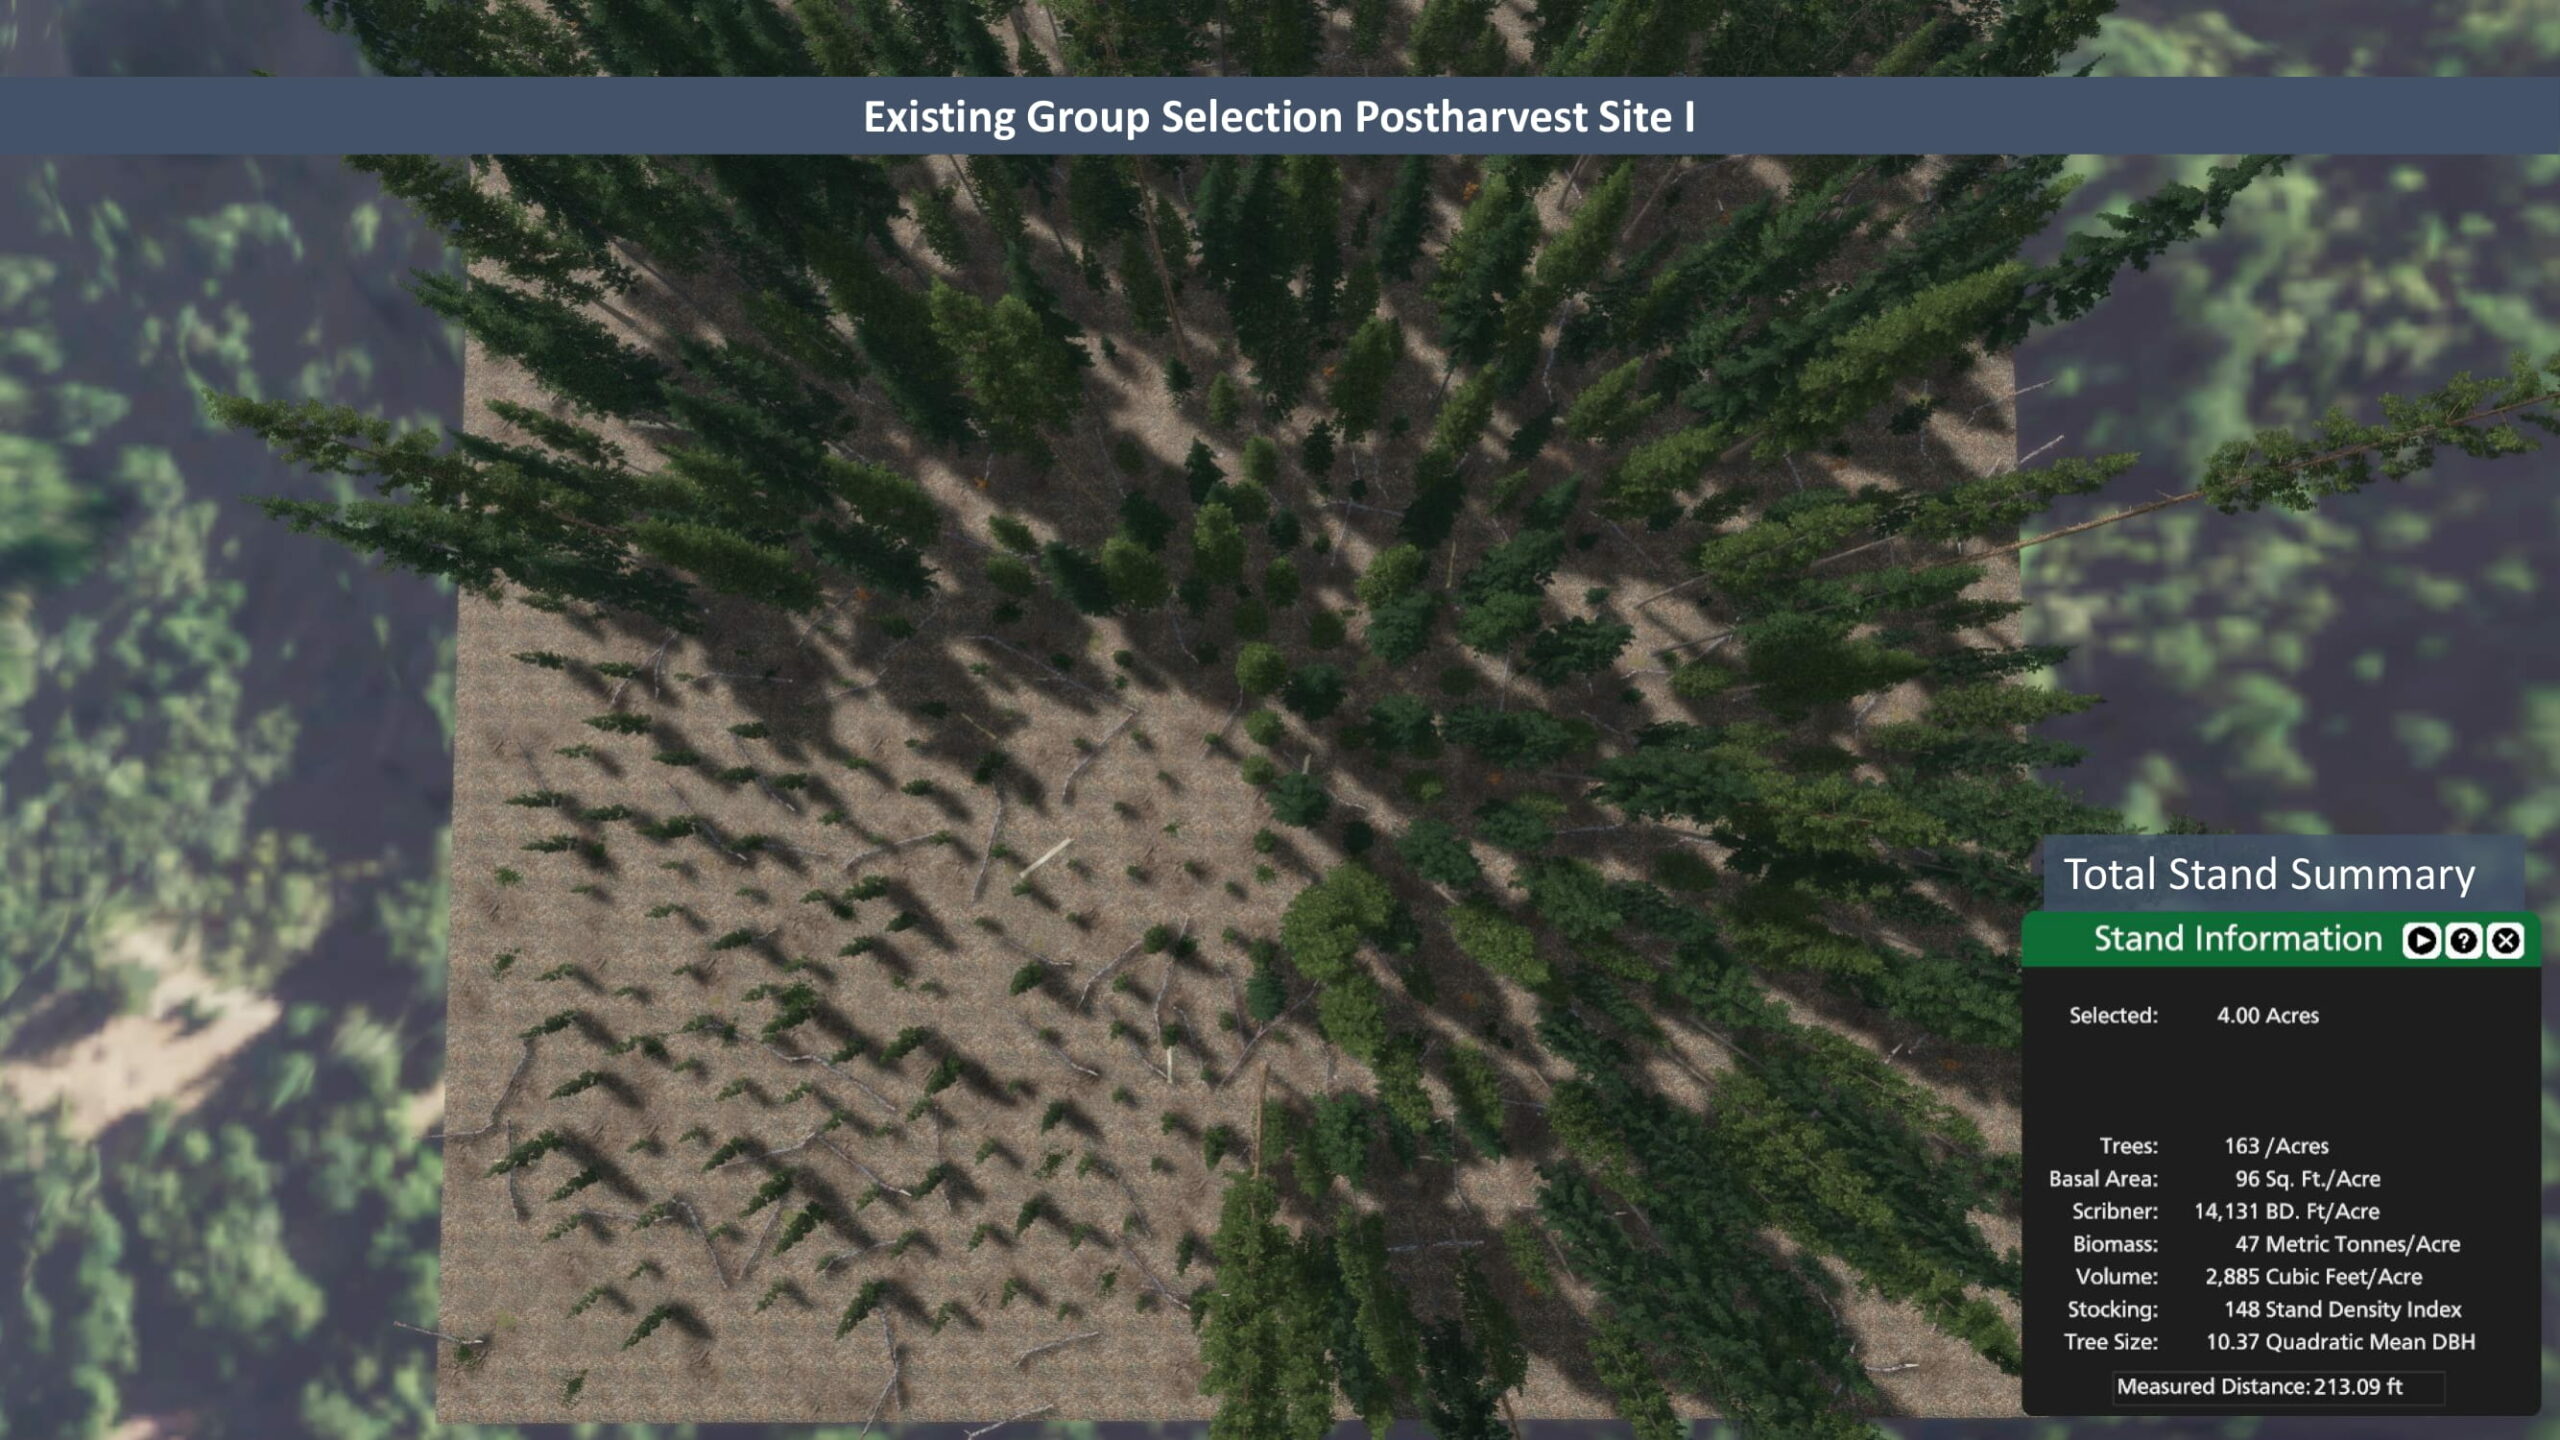
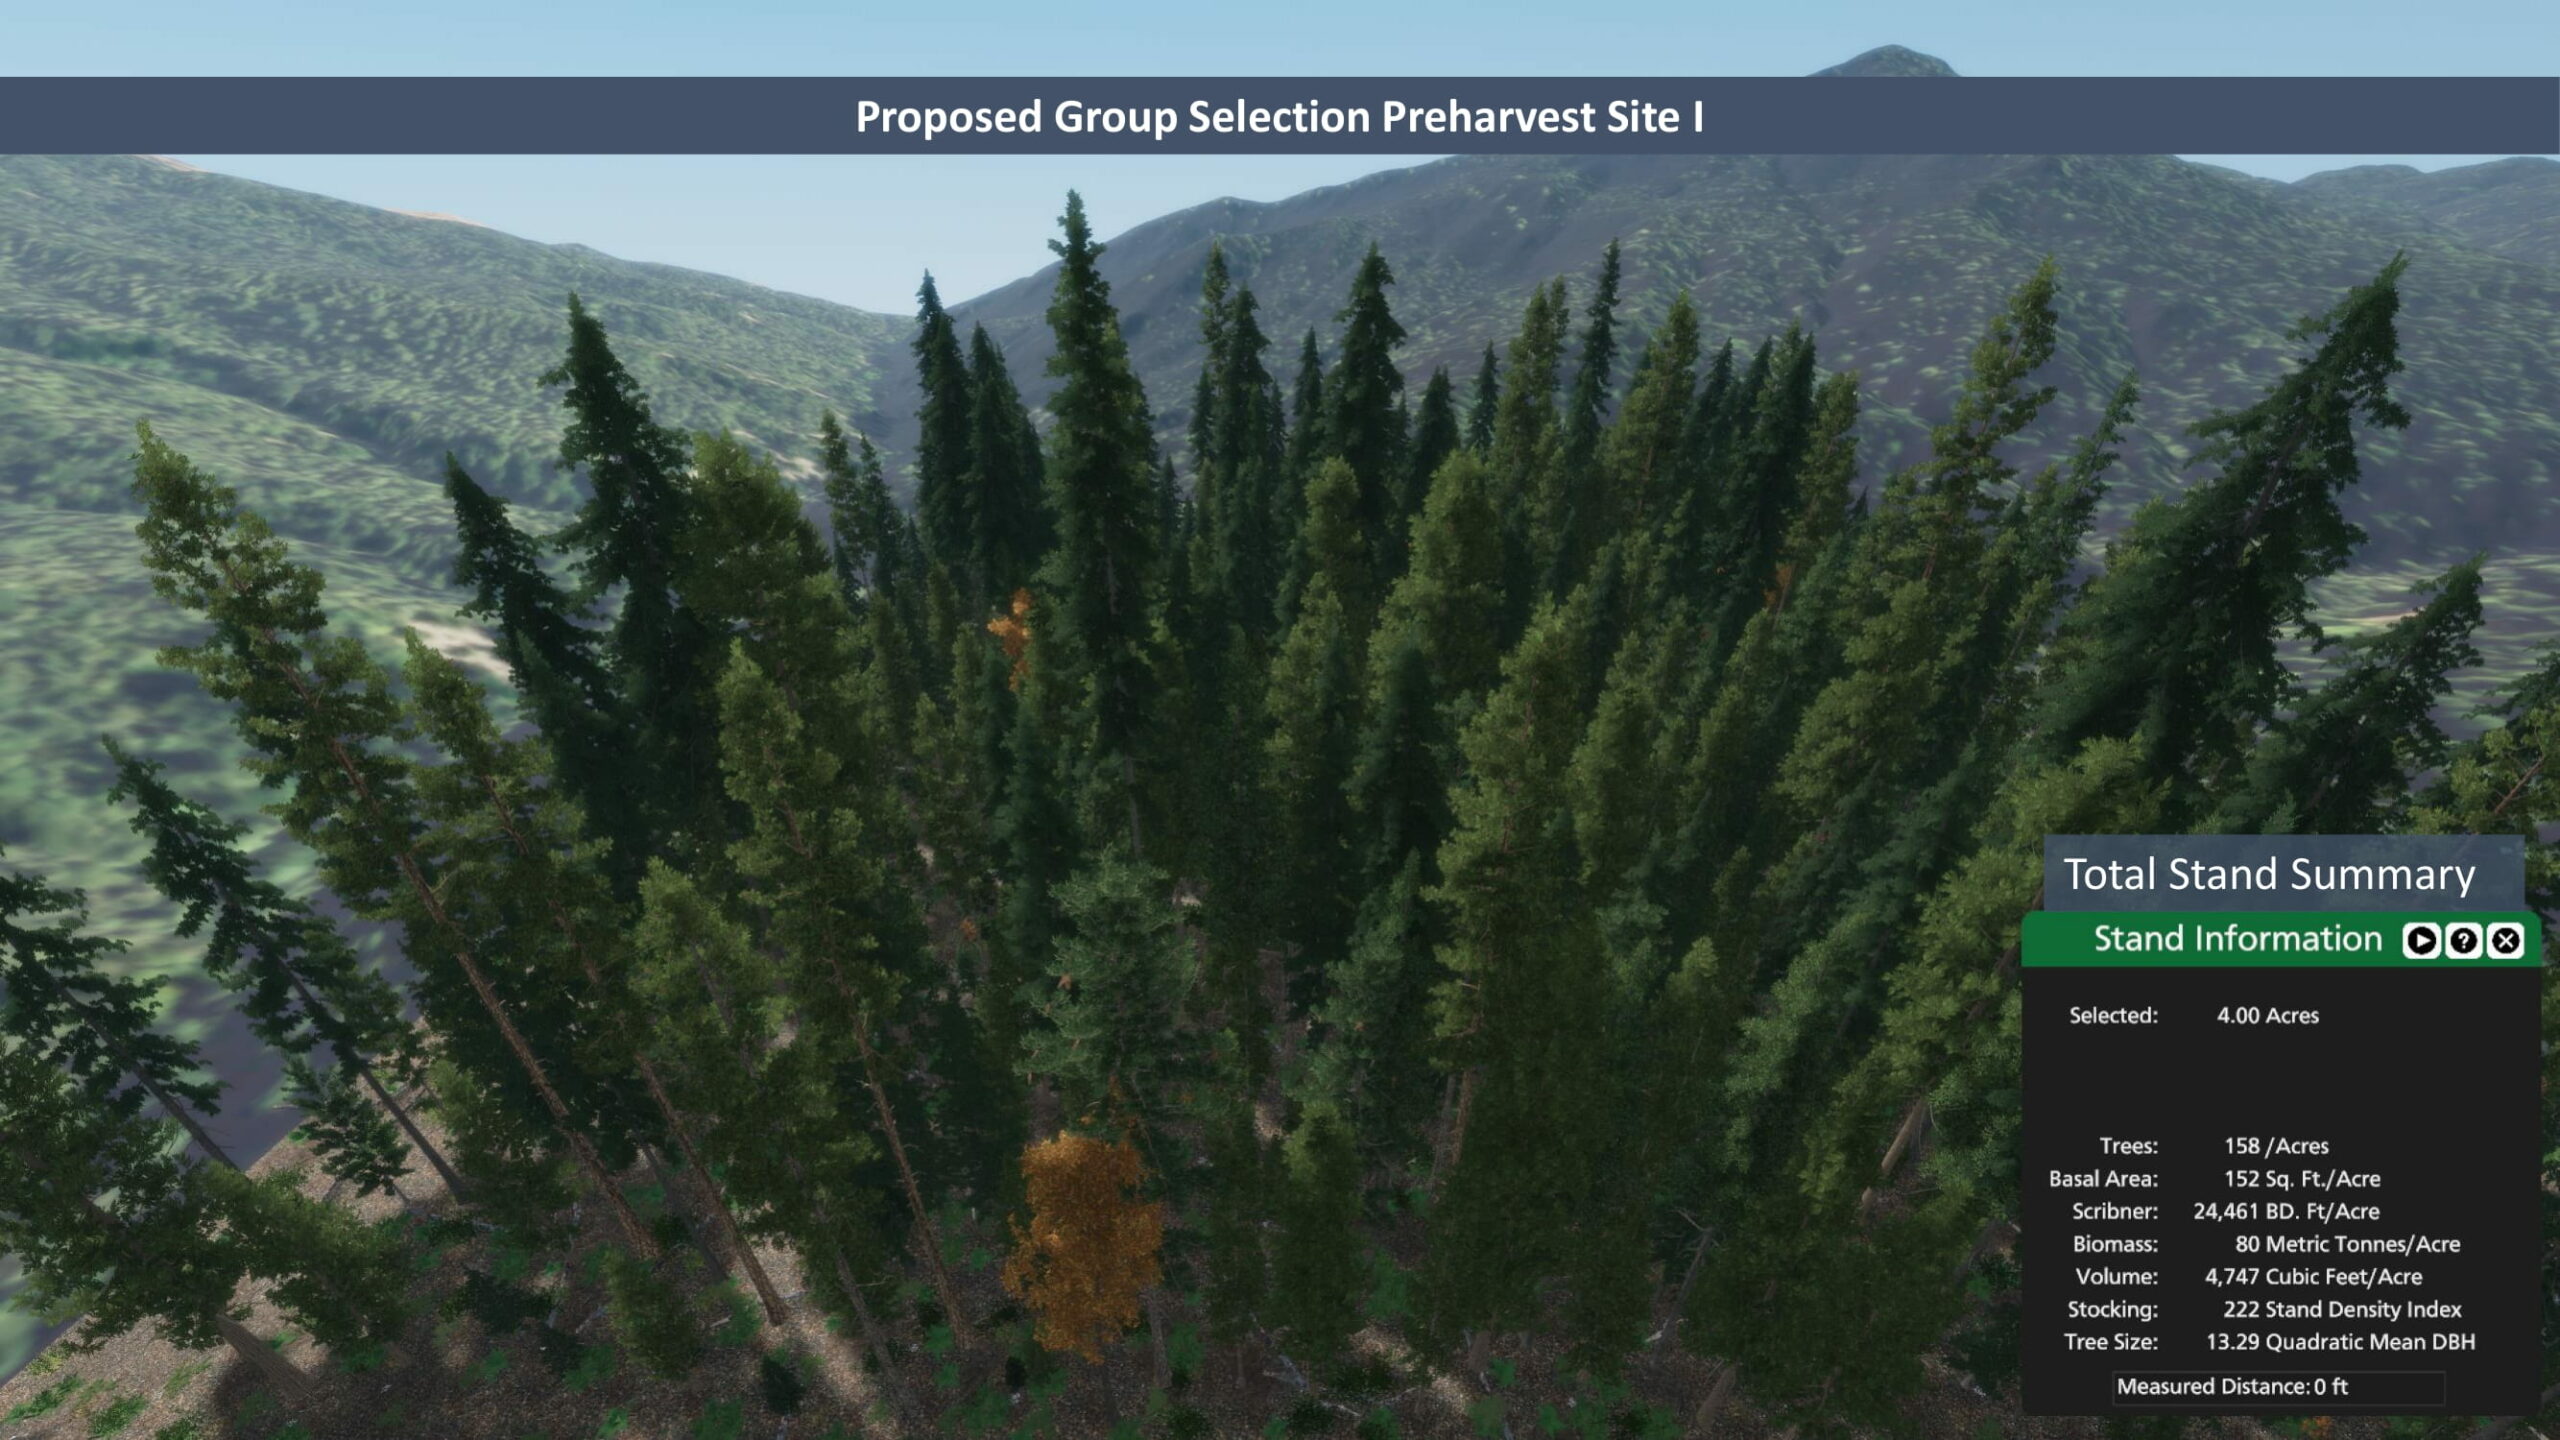
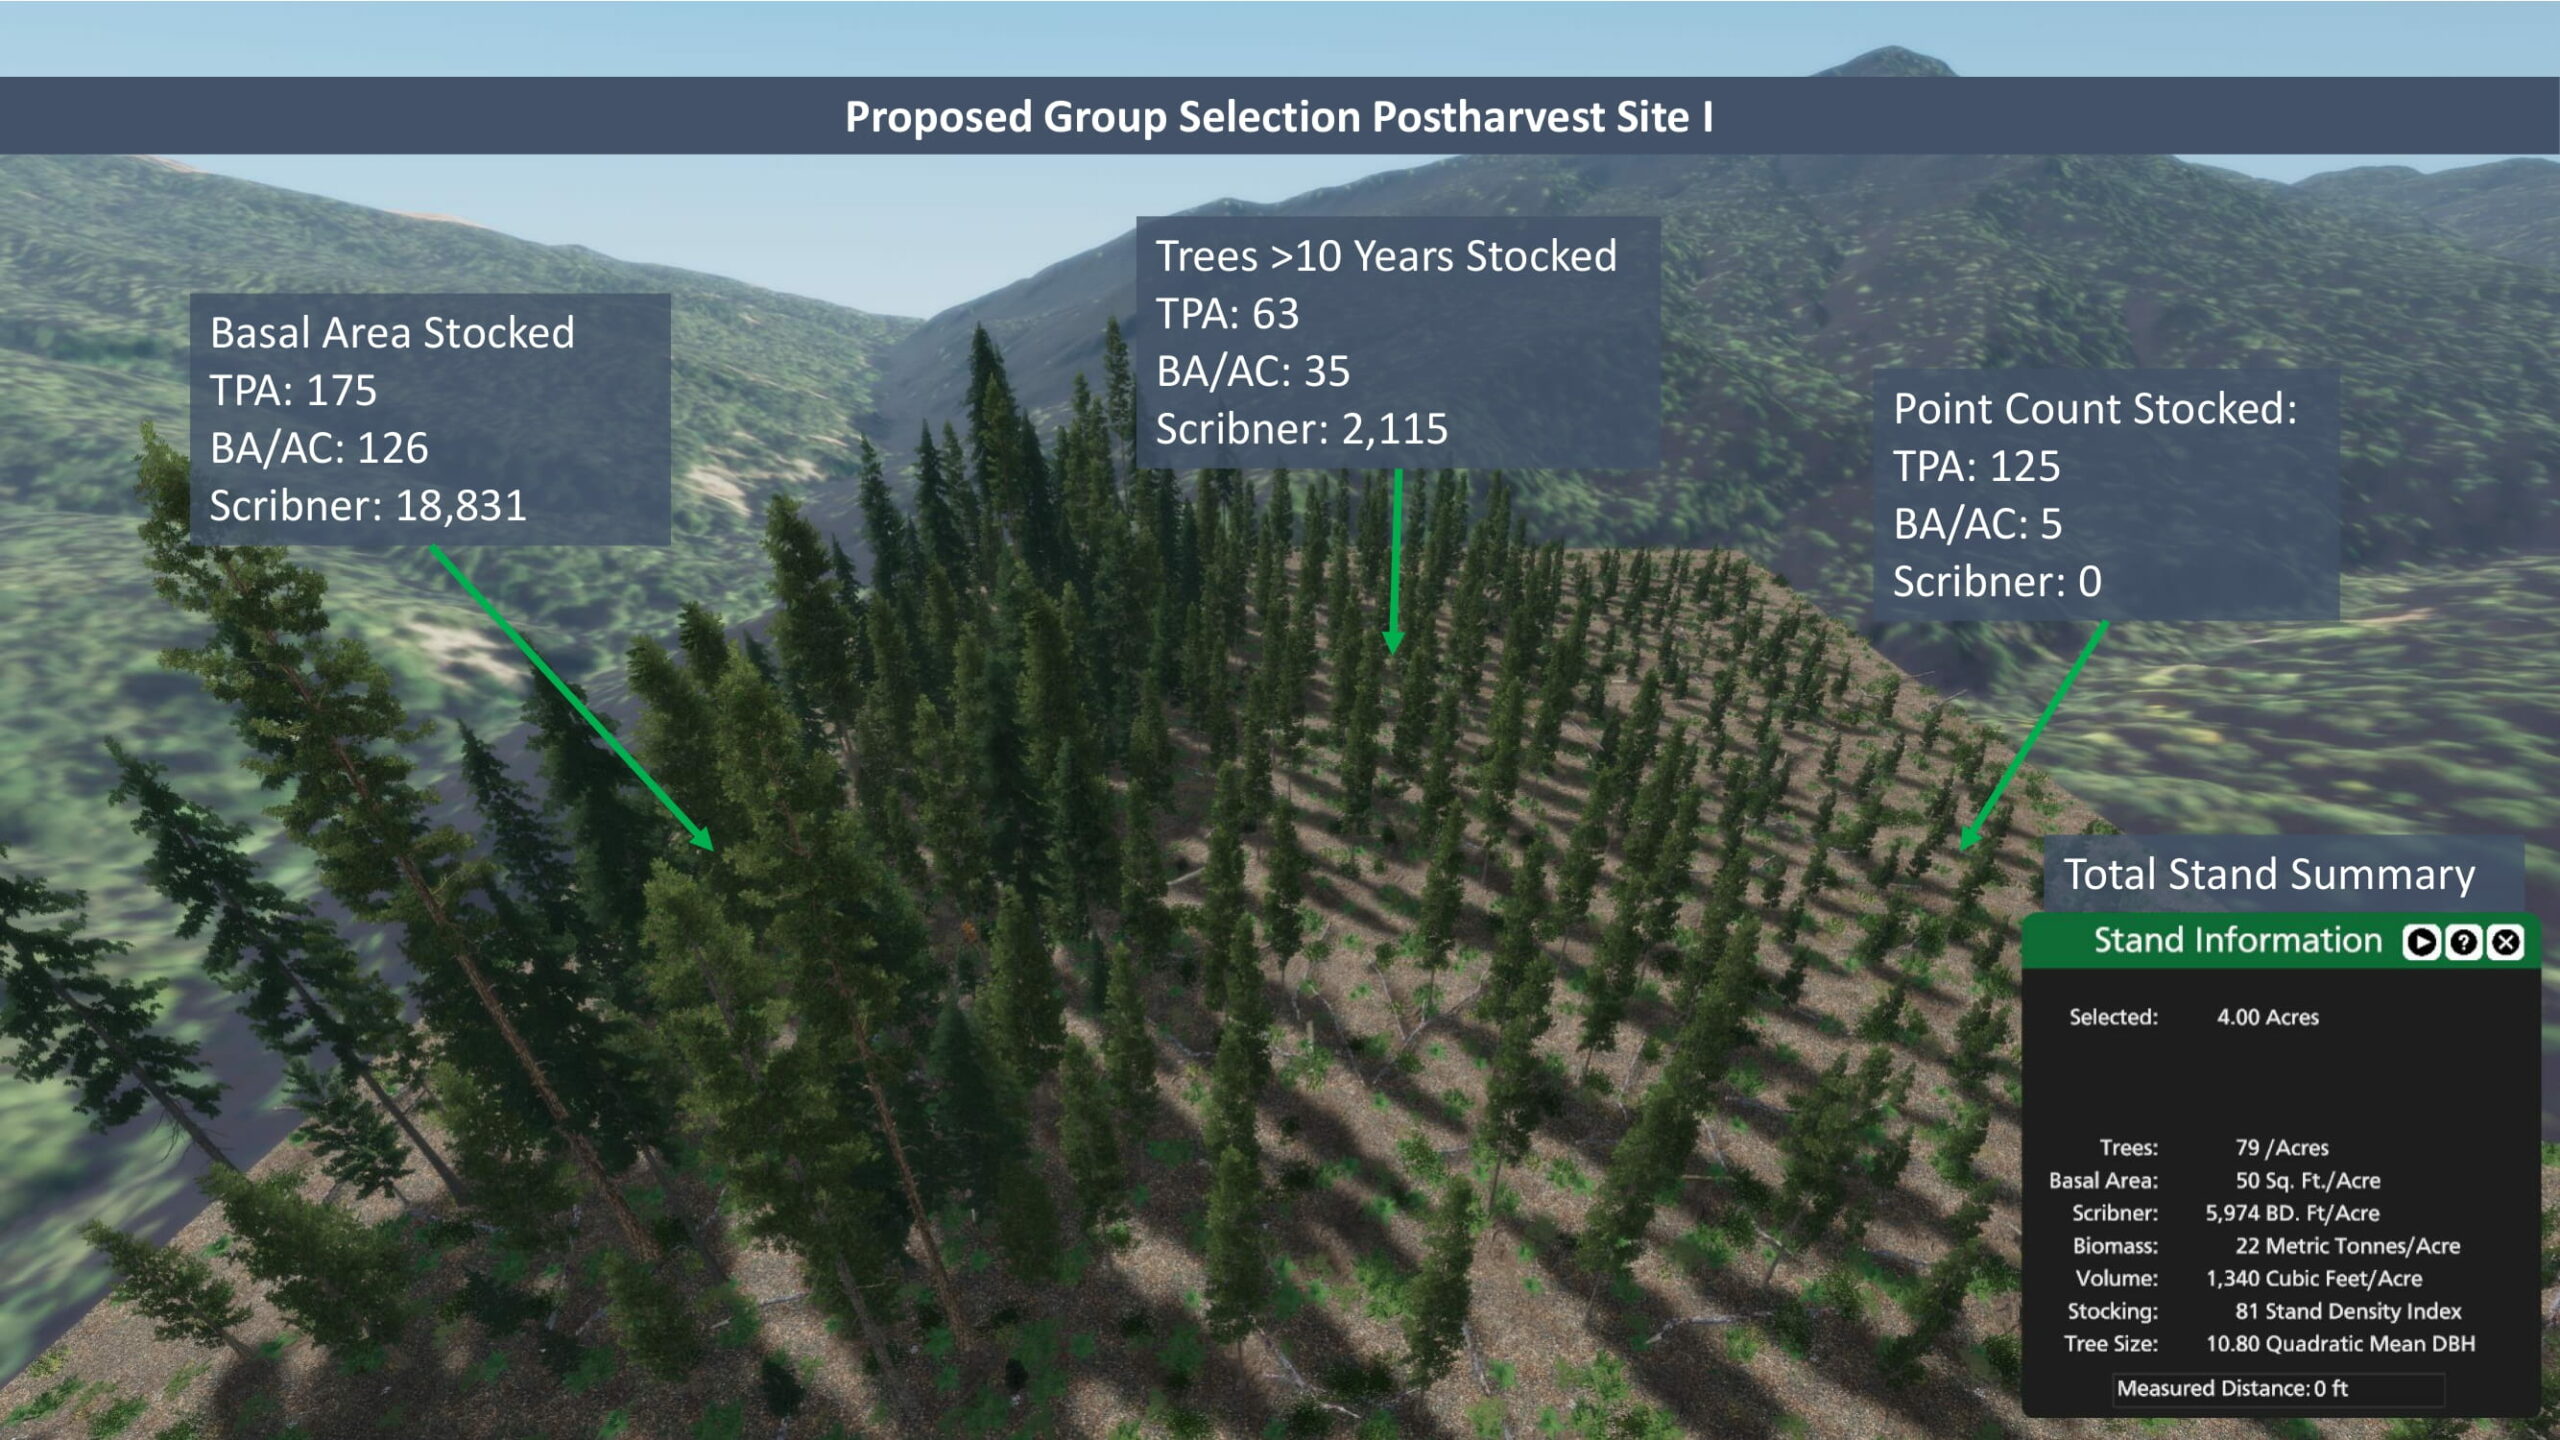
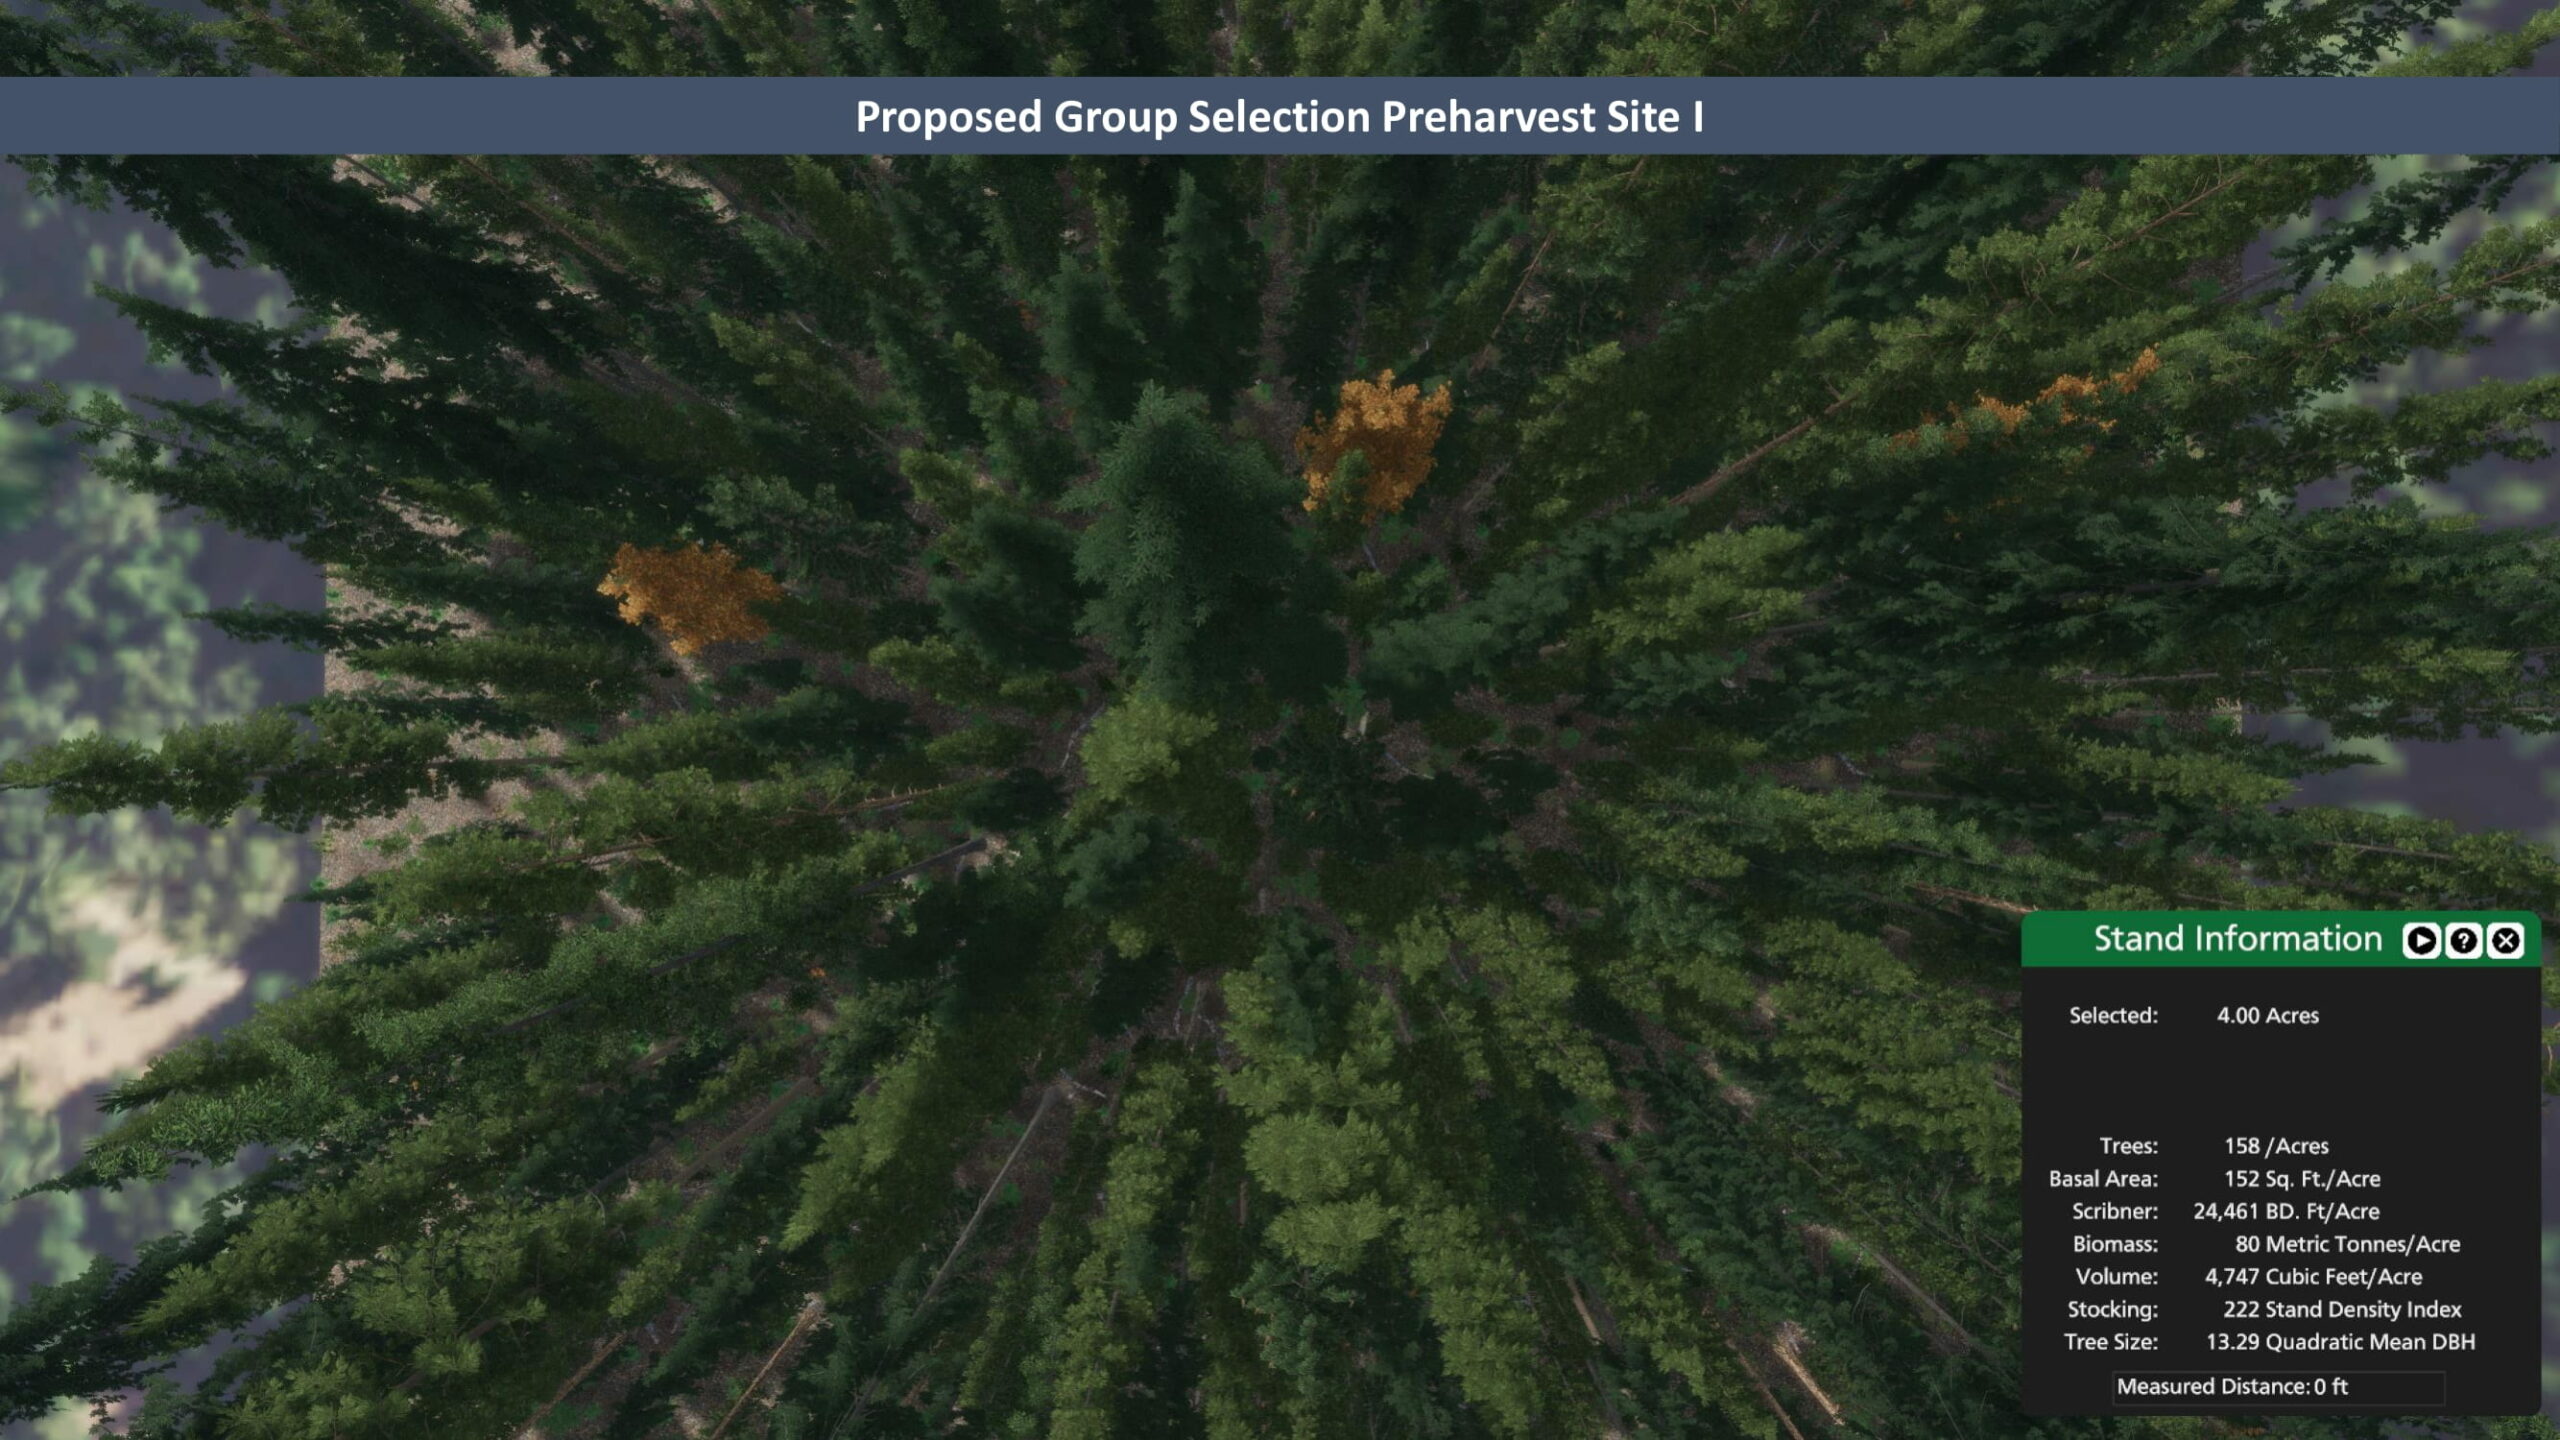
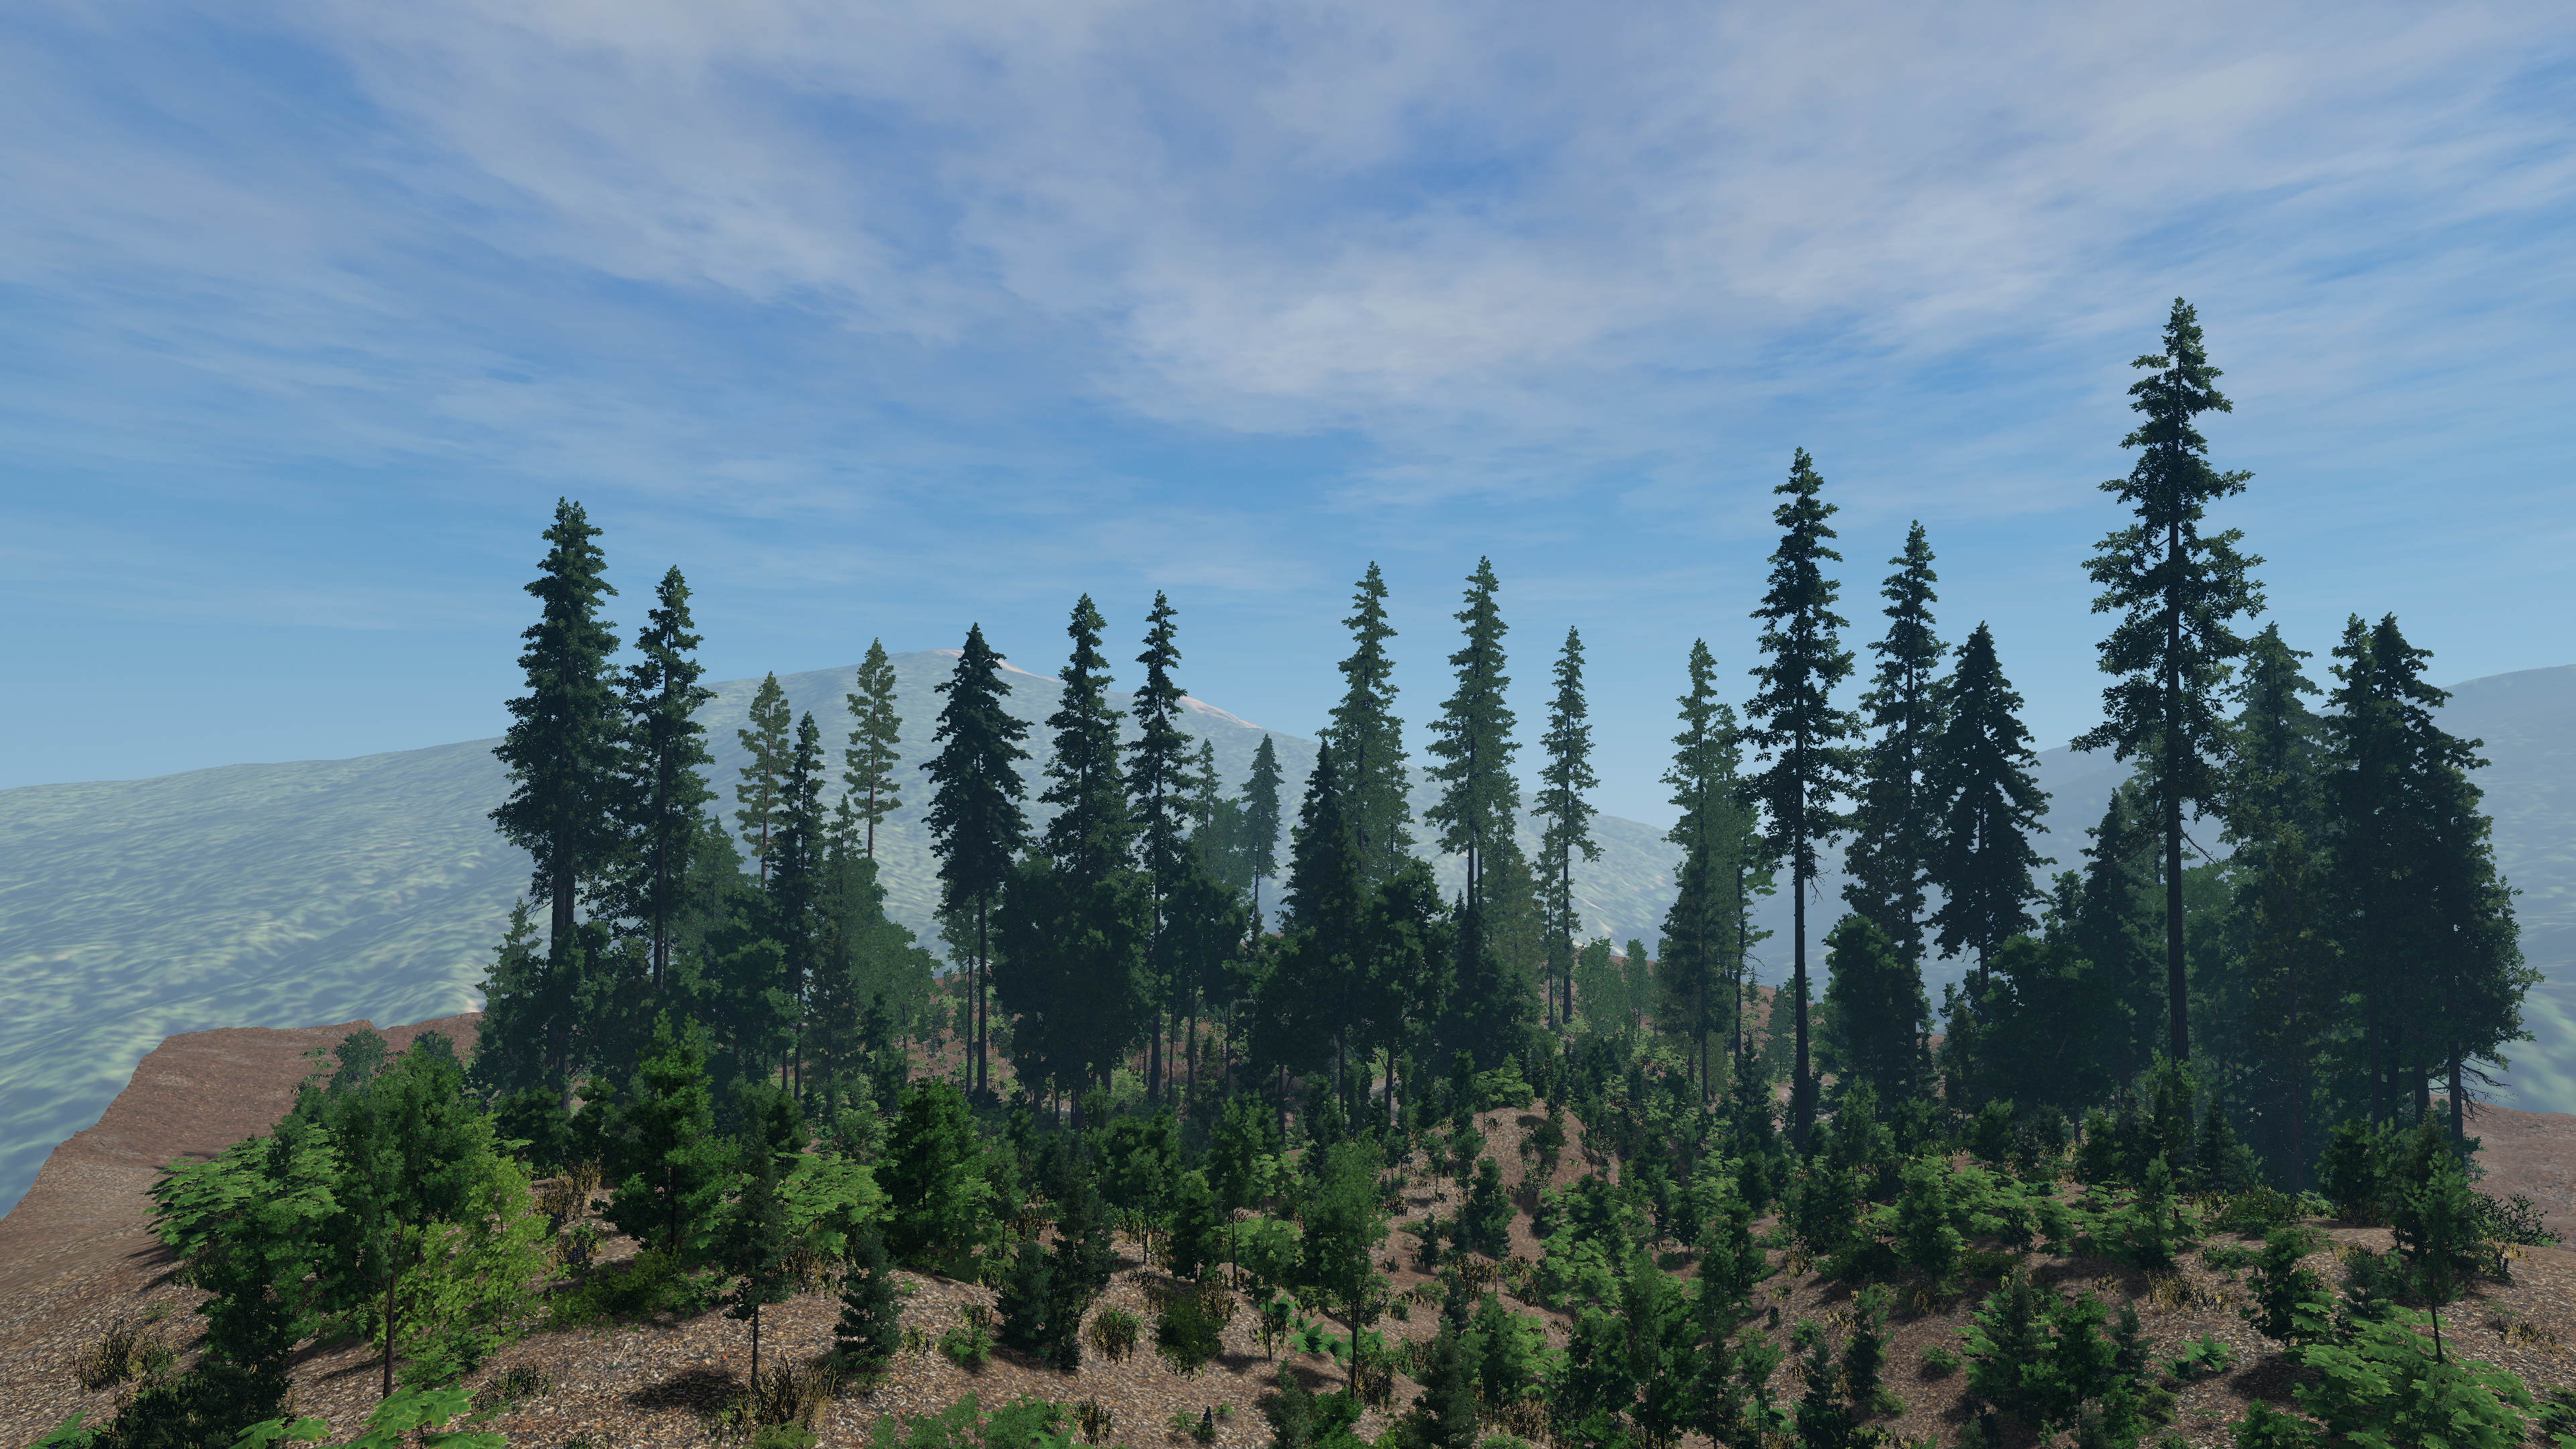
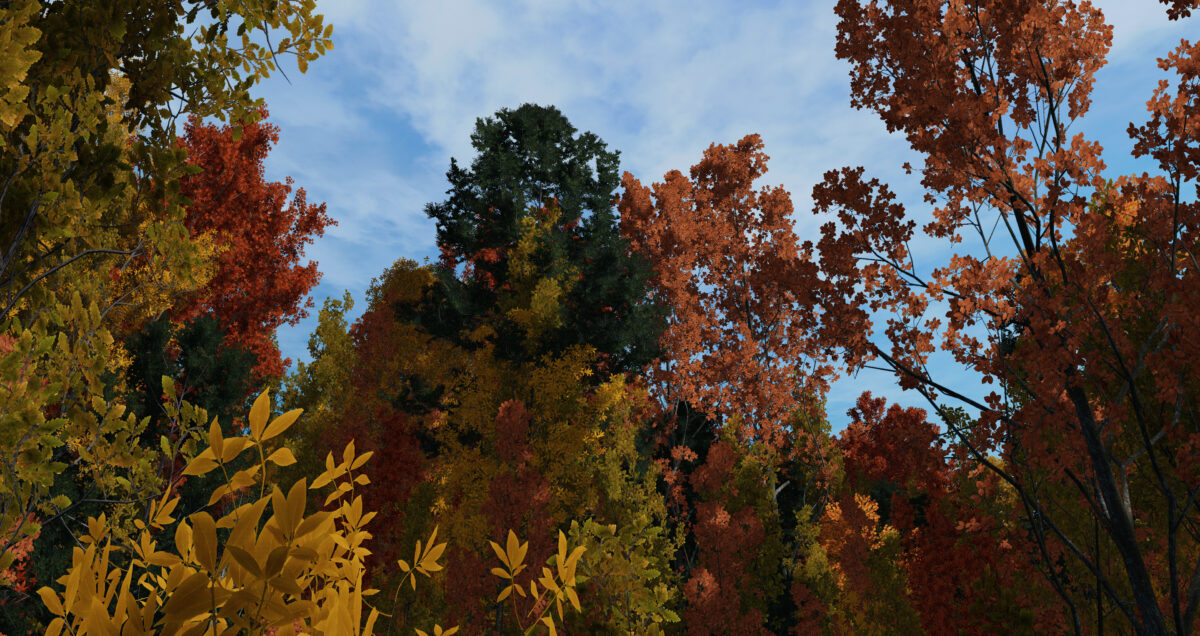
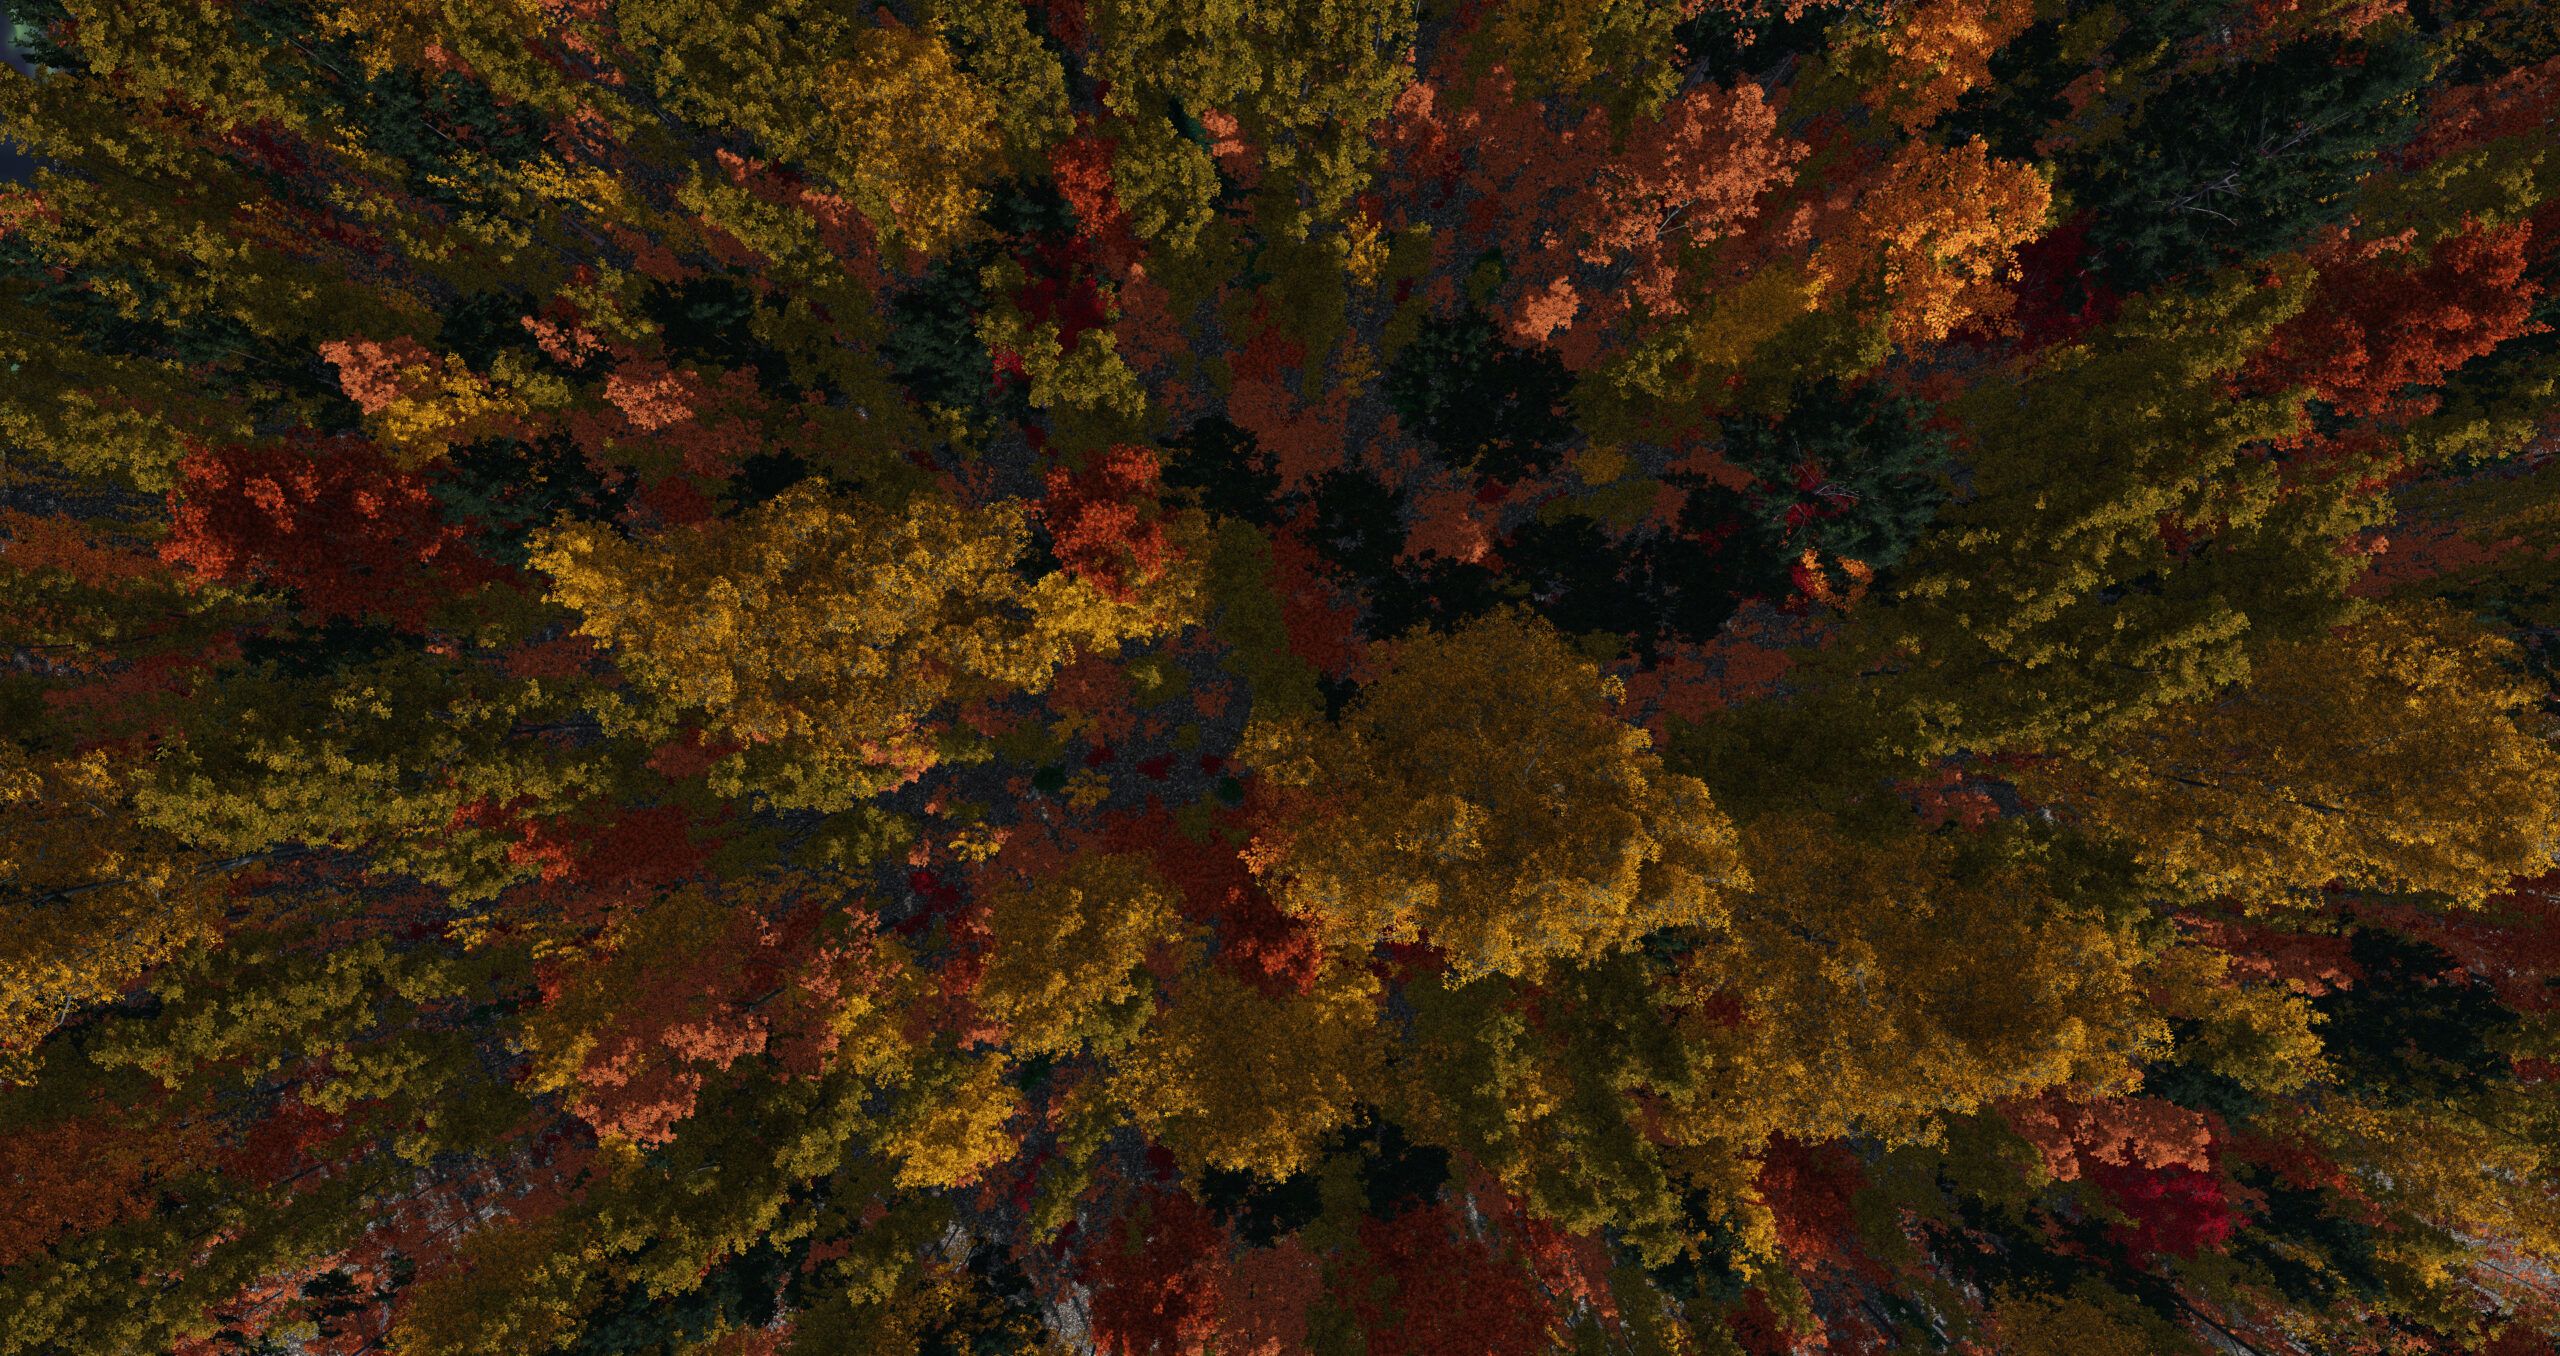
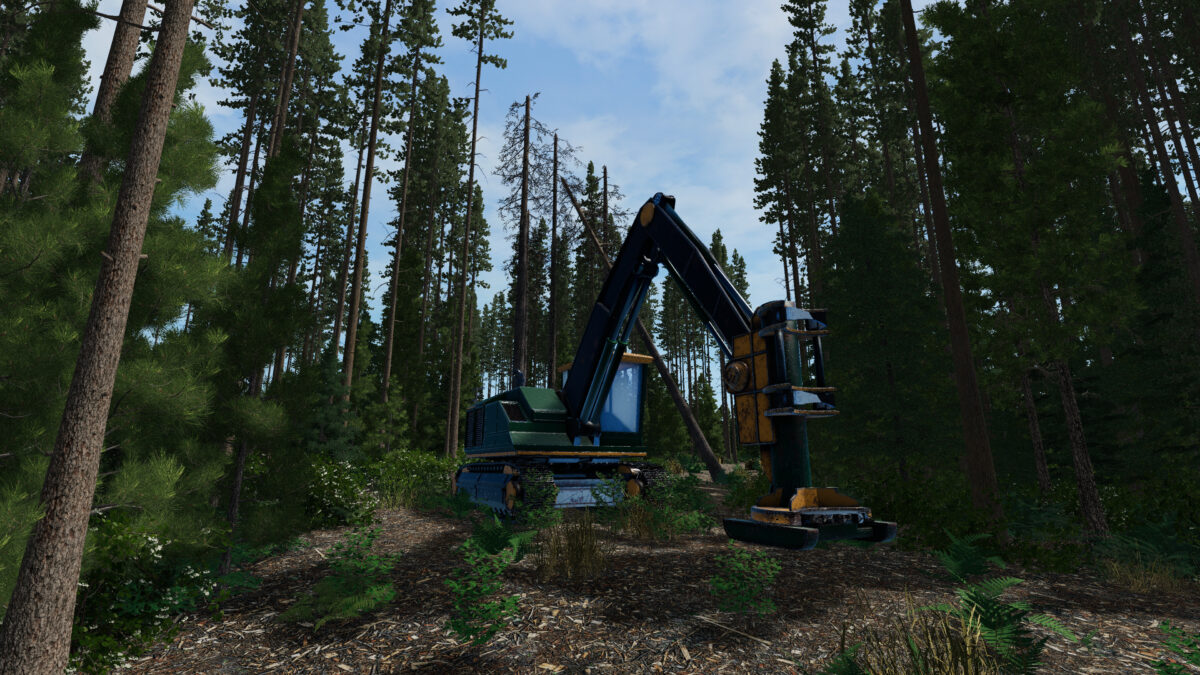
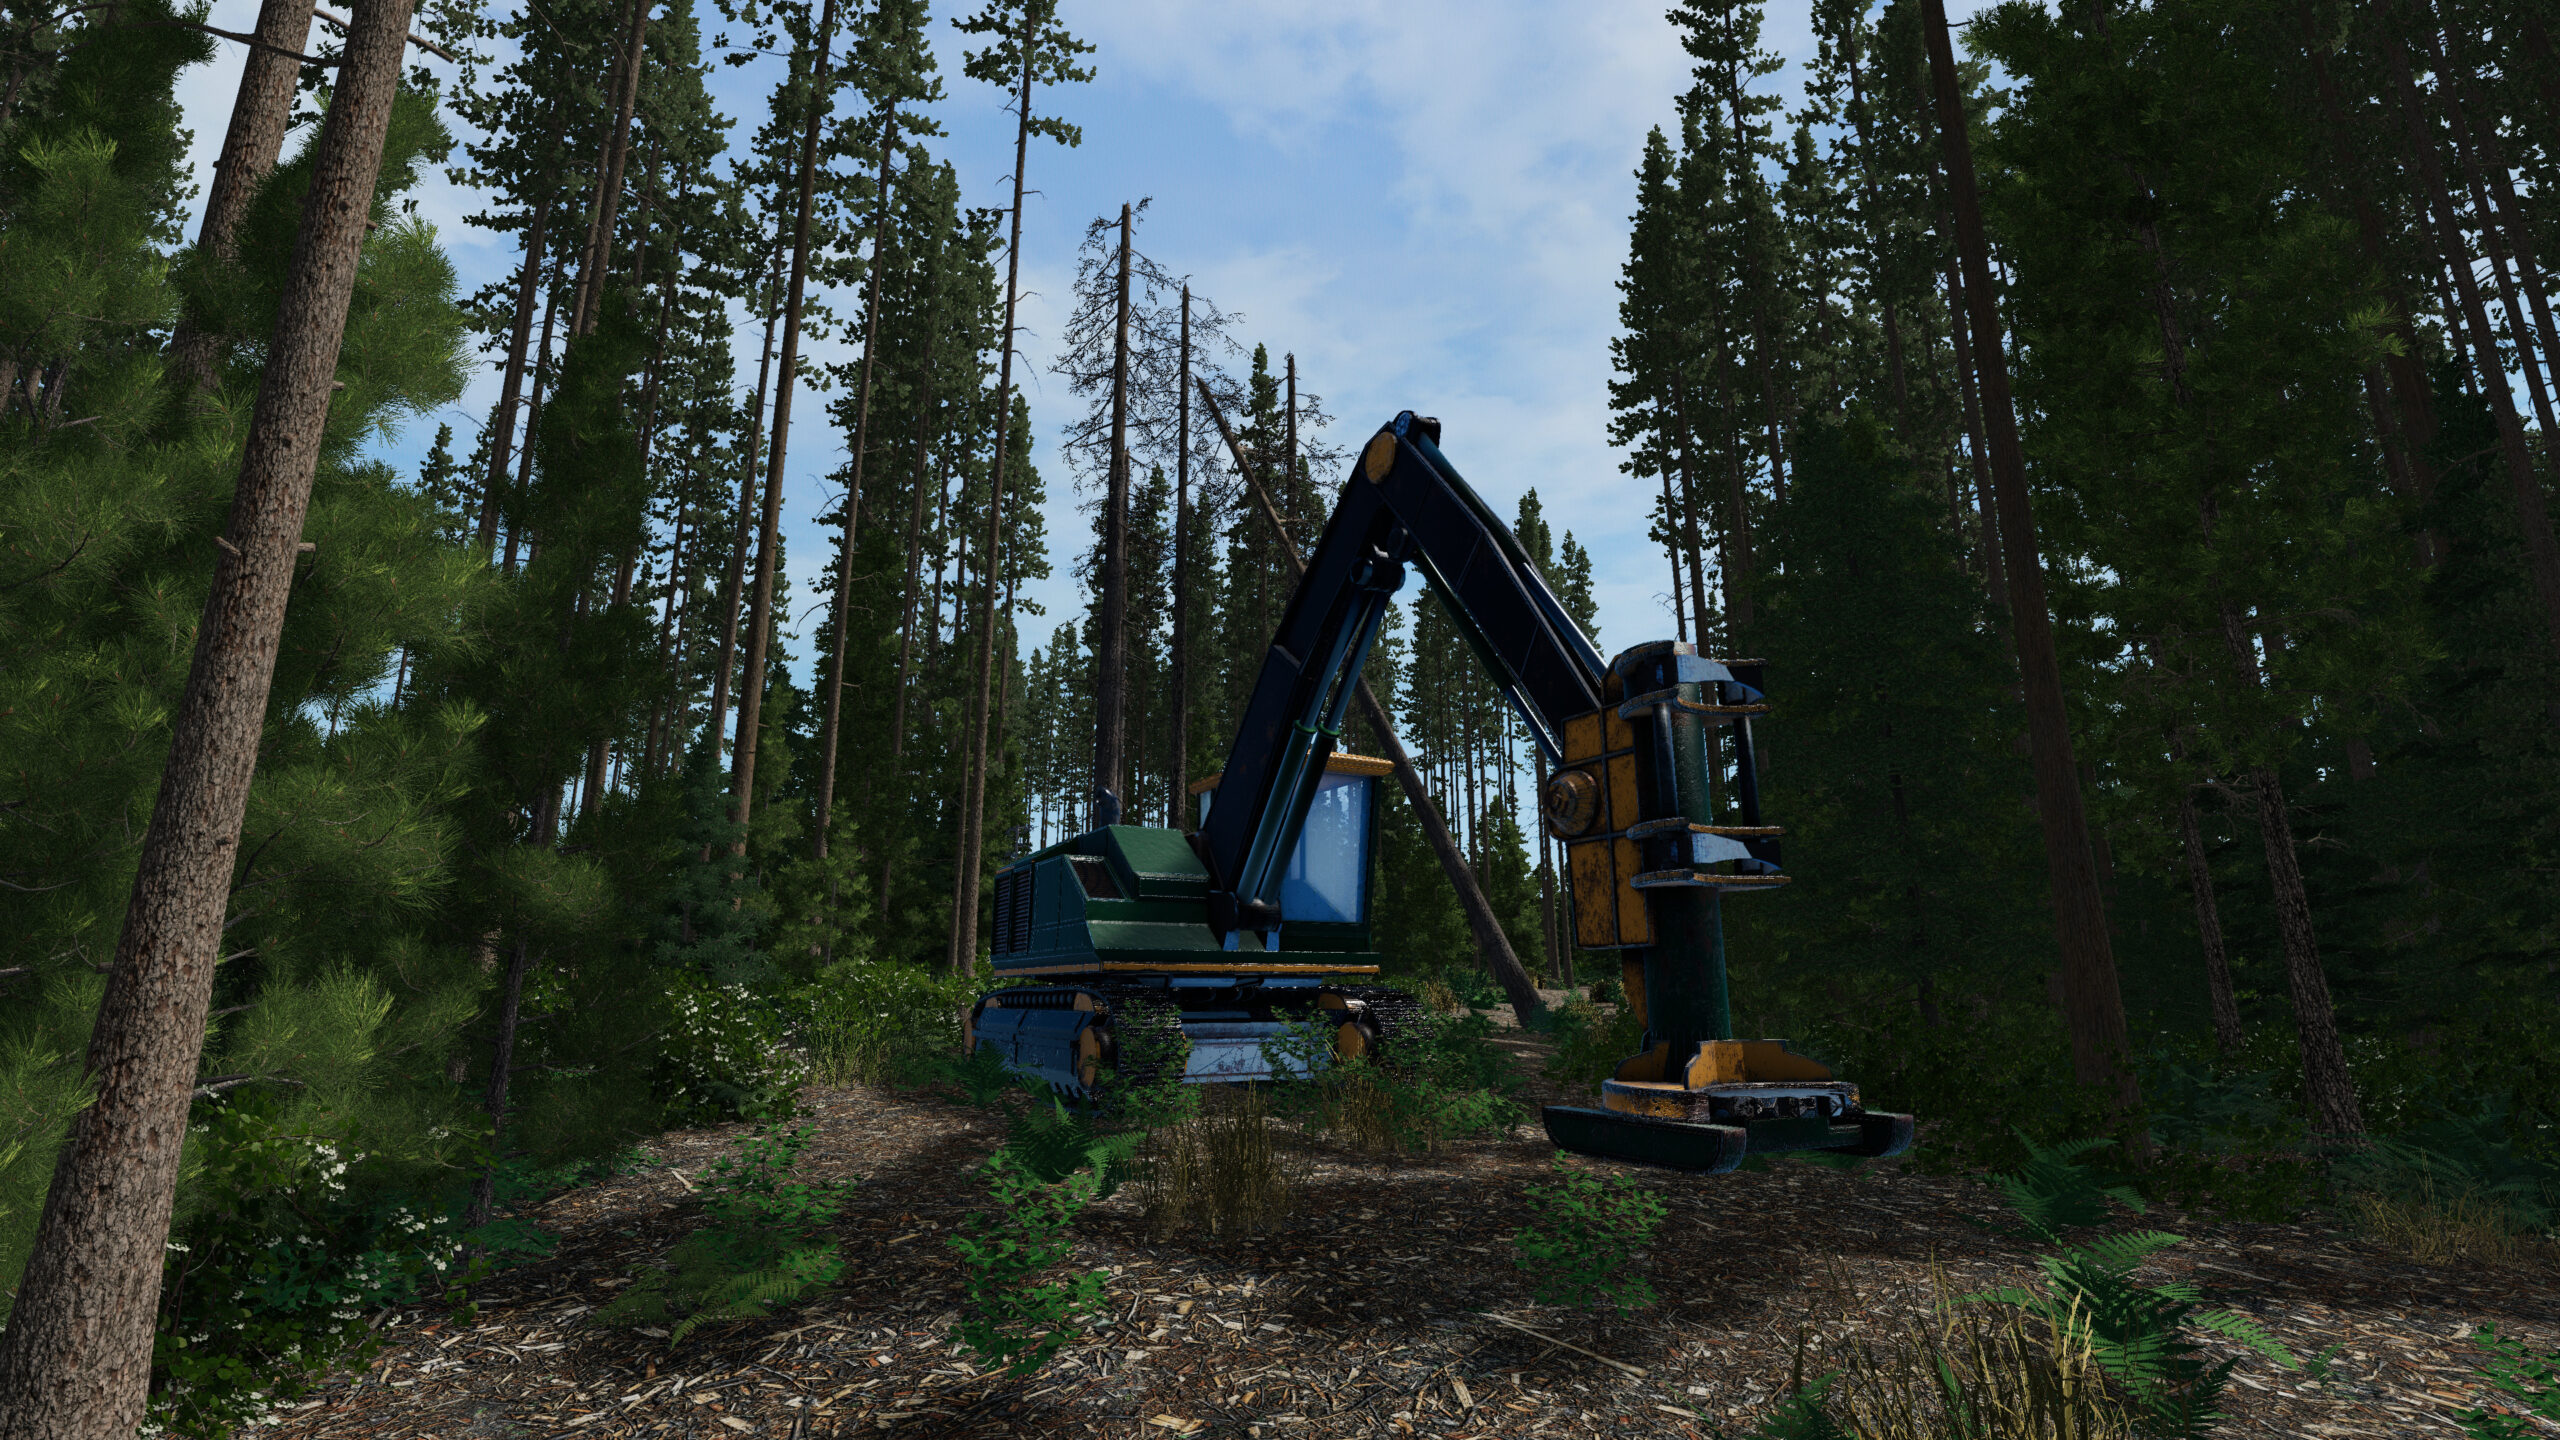
Something I made to show off a 20 year harvesting and regrowth plan I was working on.
Based on a forest in Northern California.
I have the .vl available below if you want to take a look for yourself
Image 1:
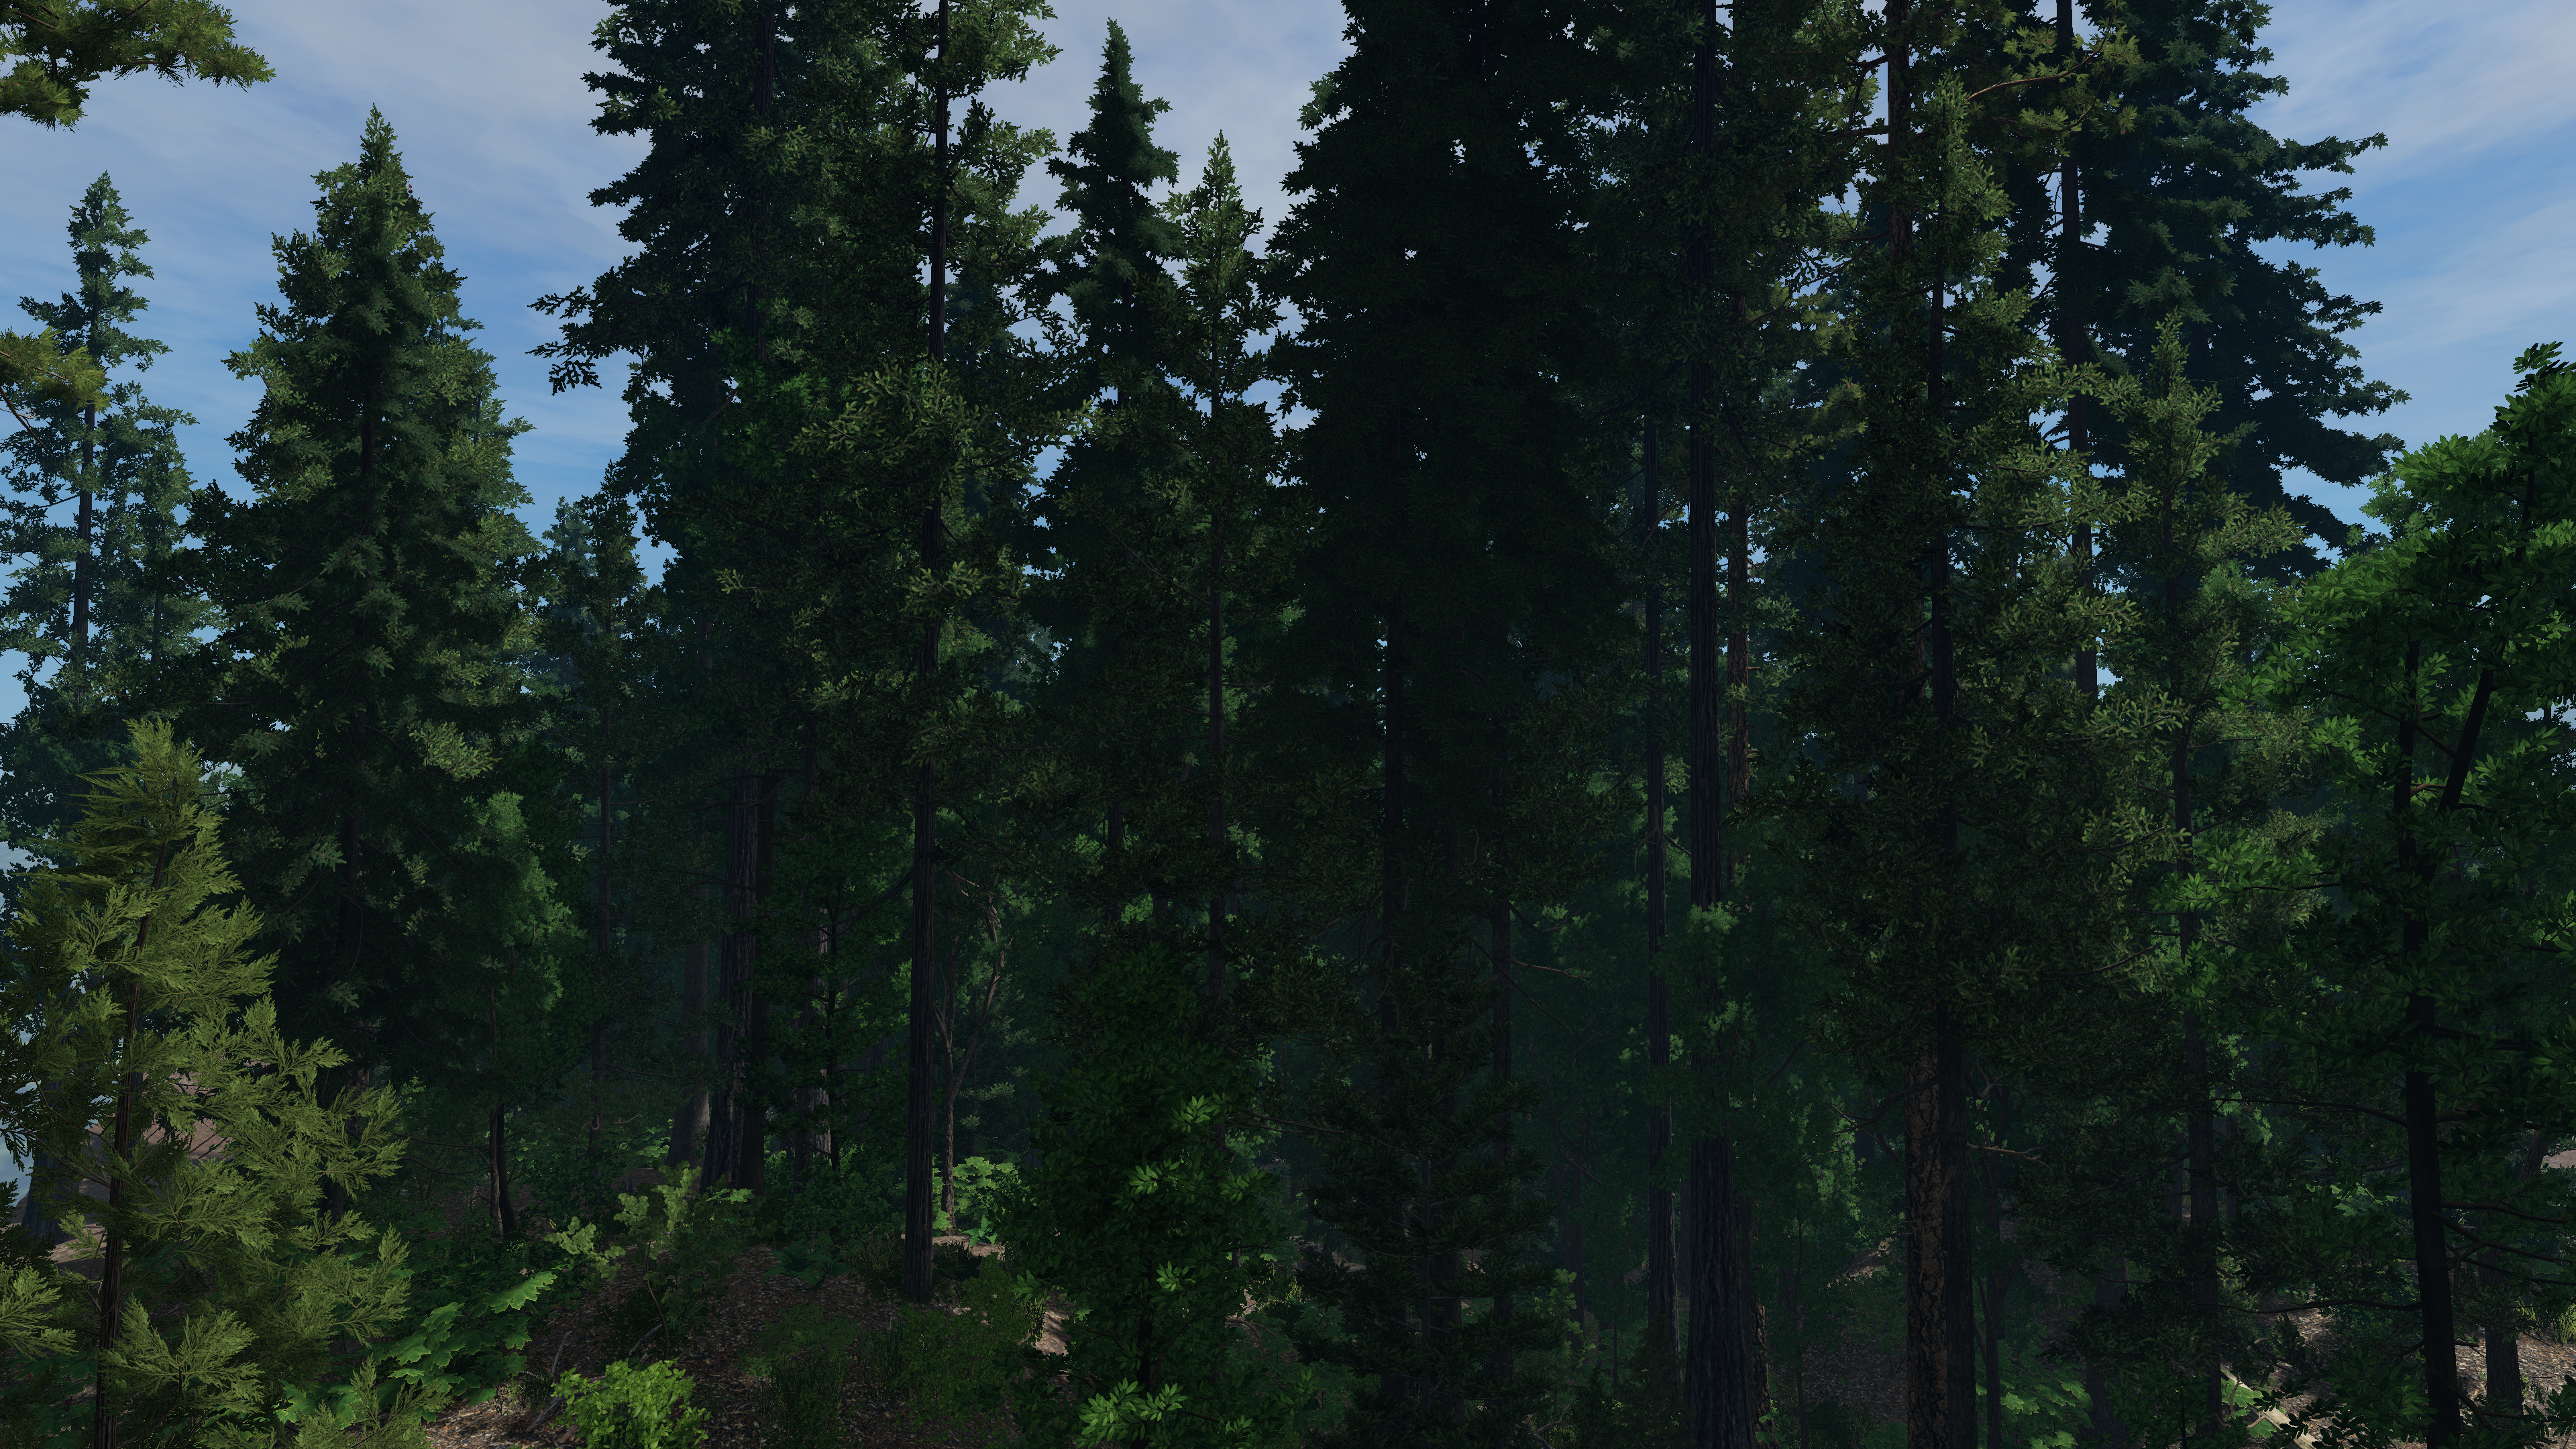
Image 2:
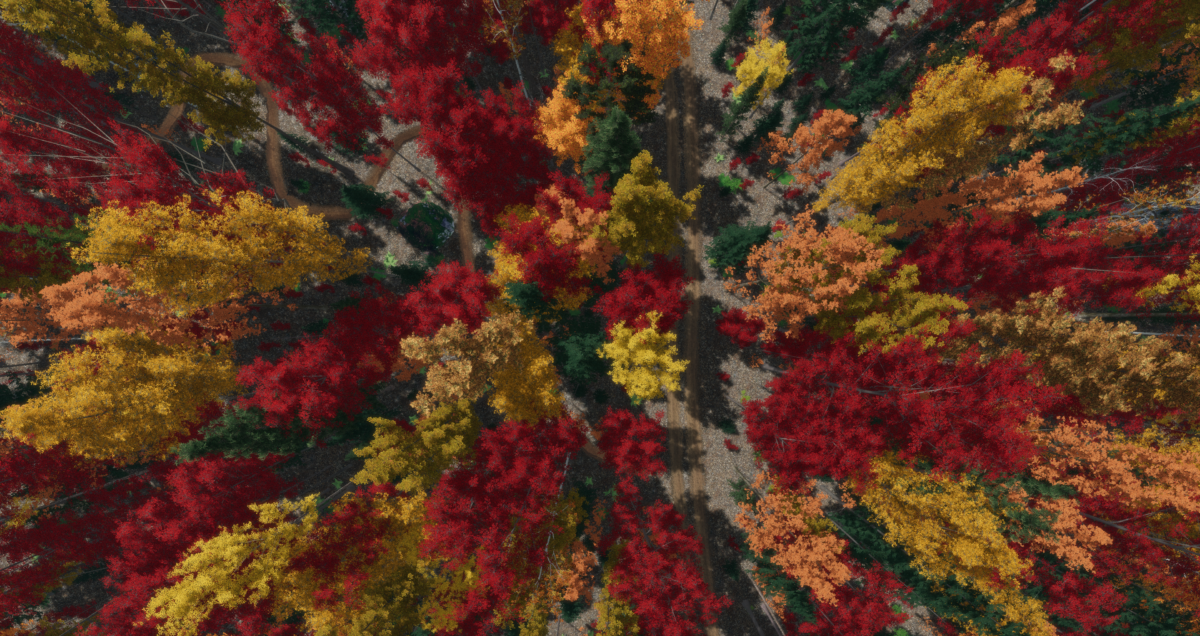
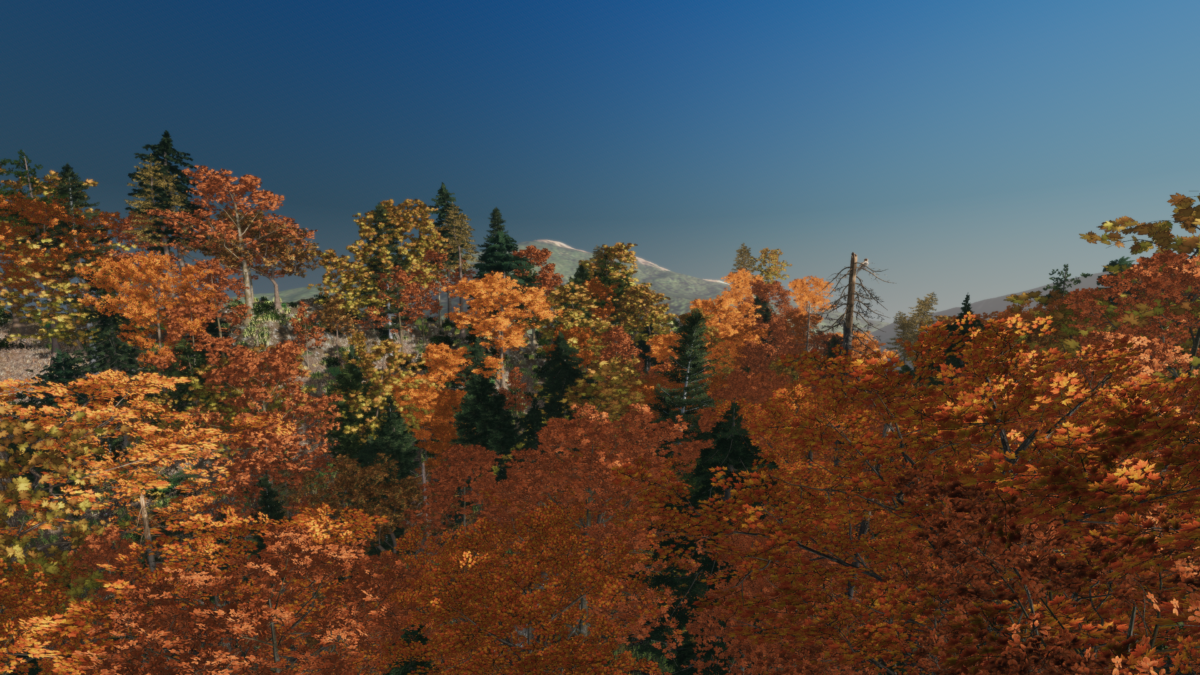
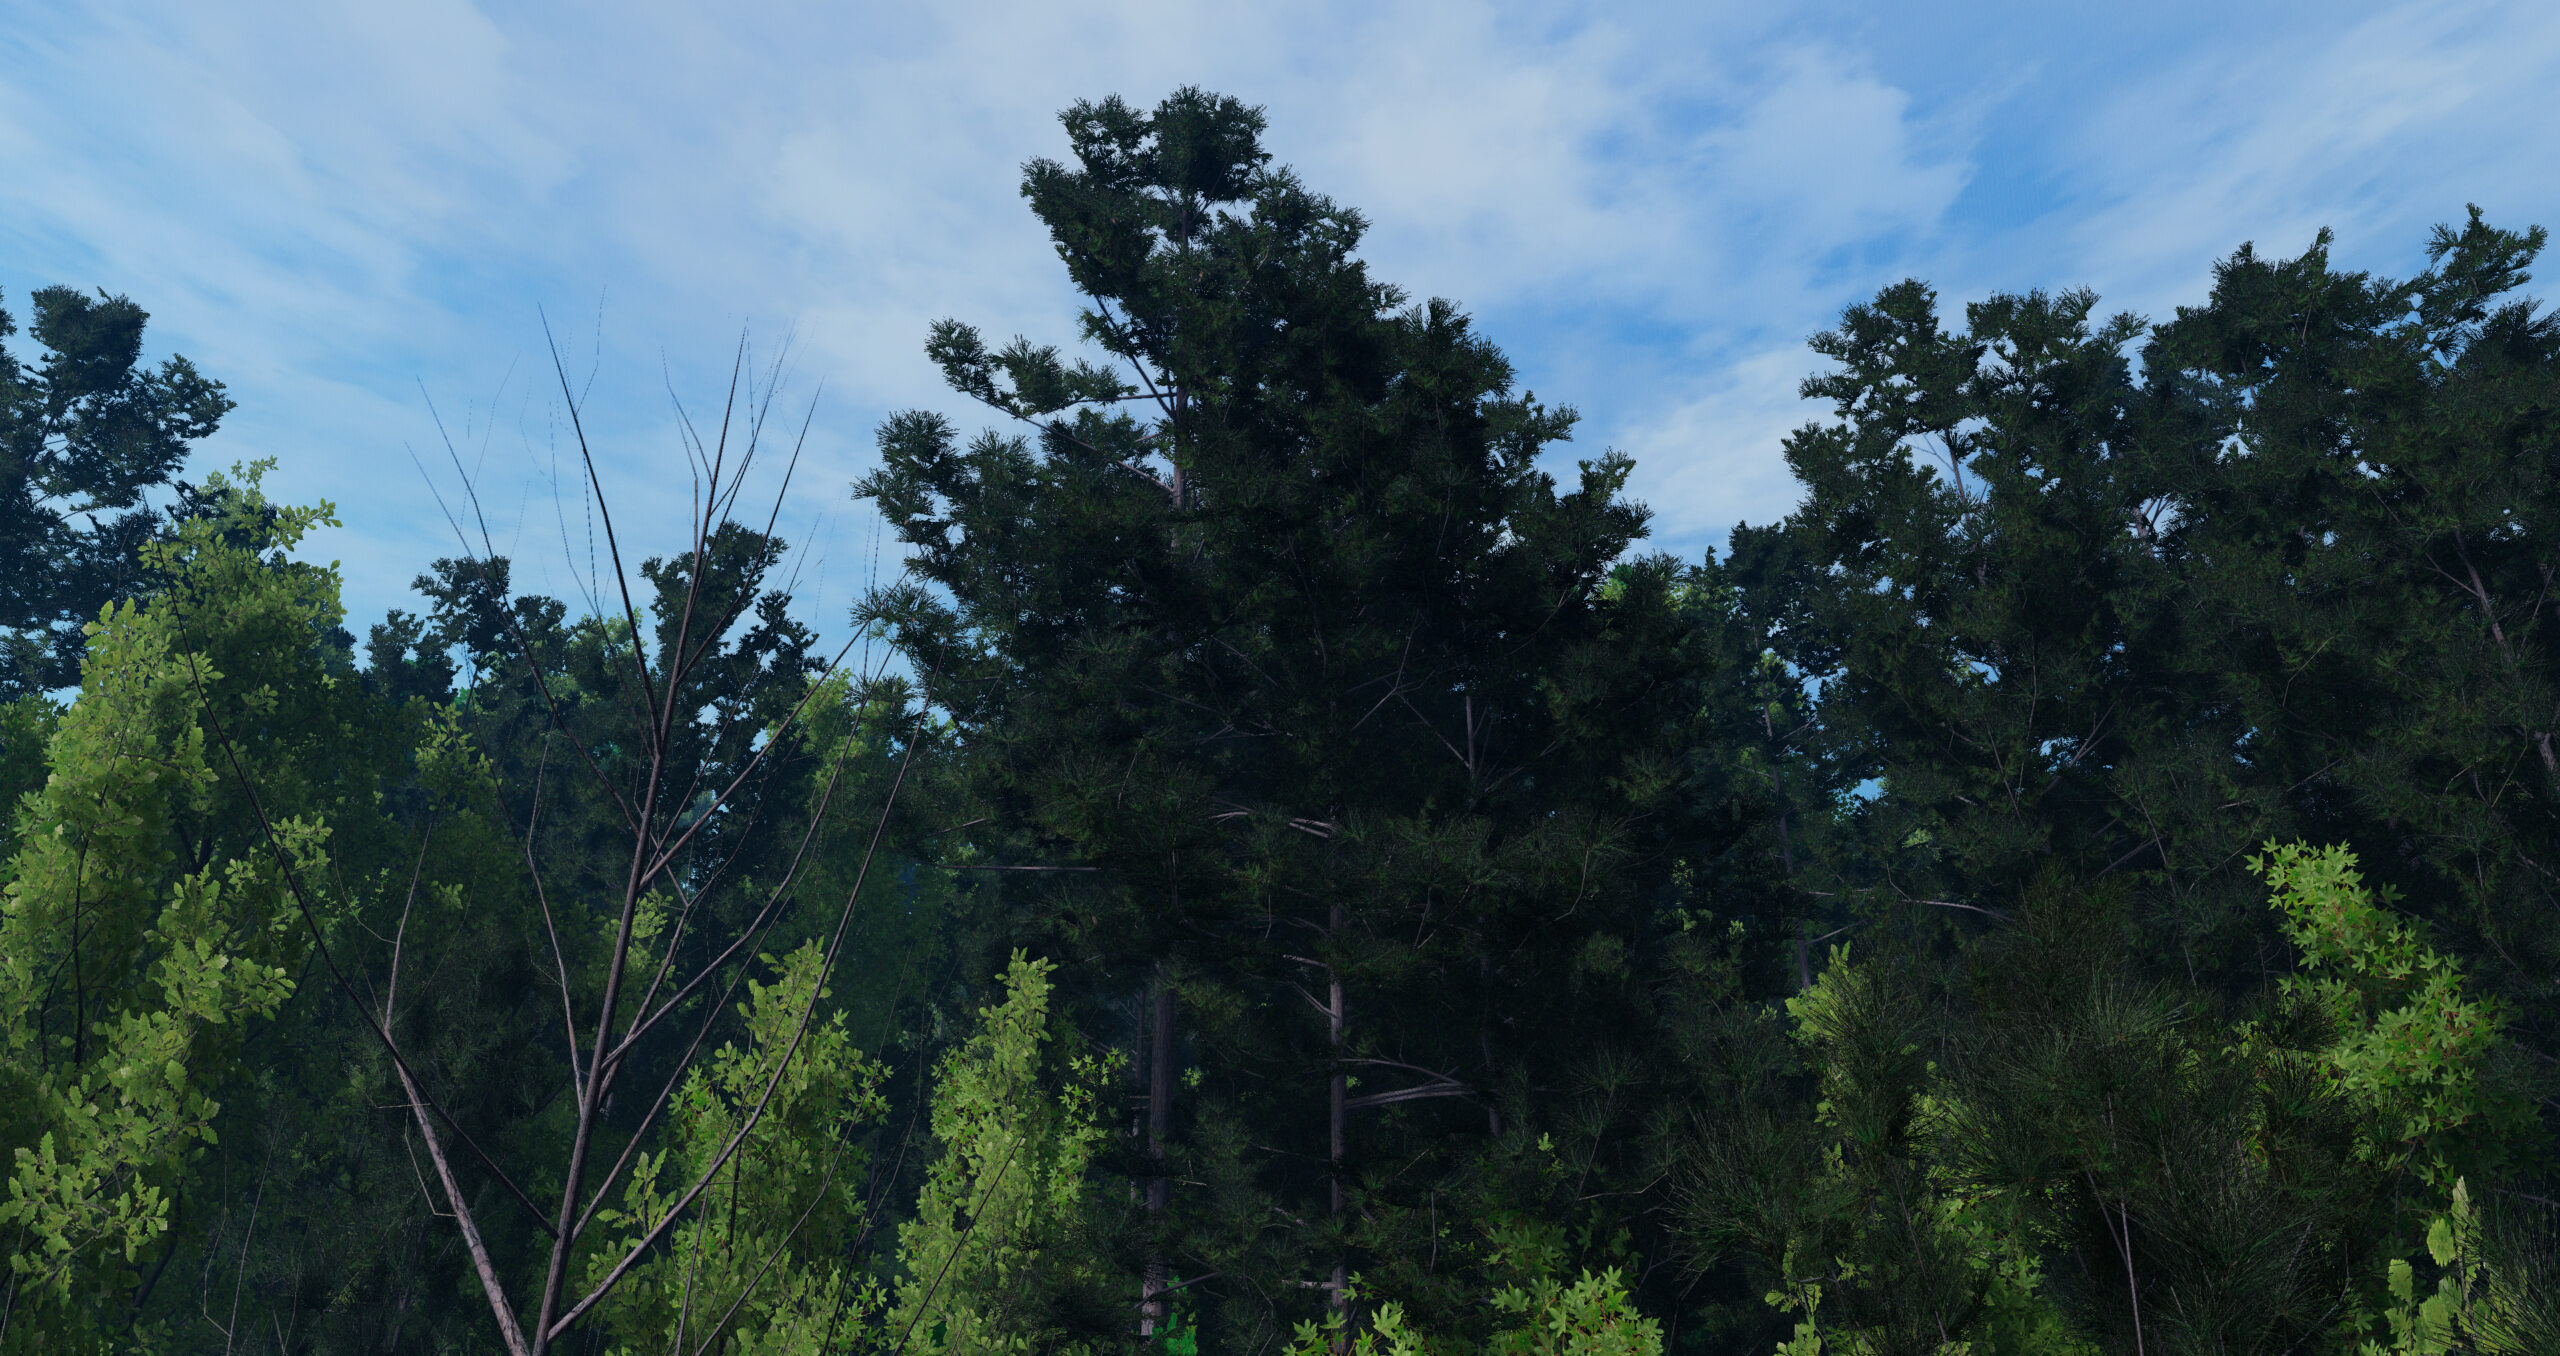
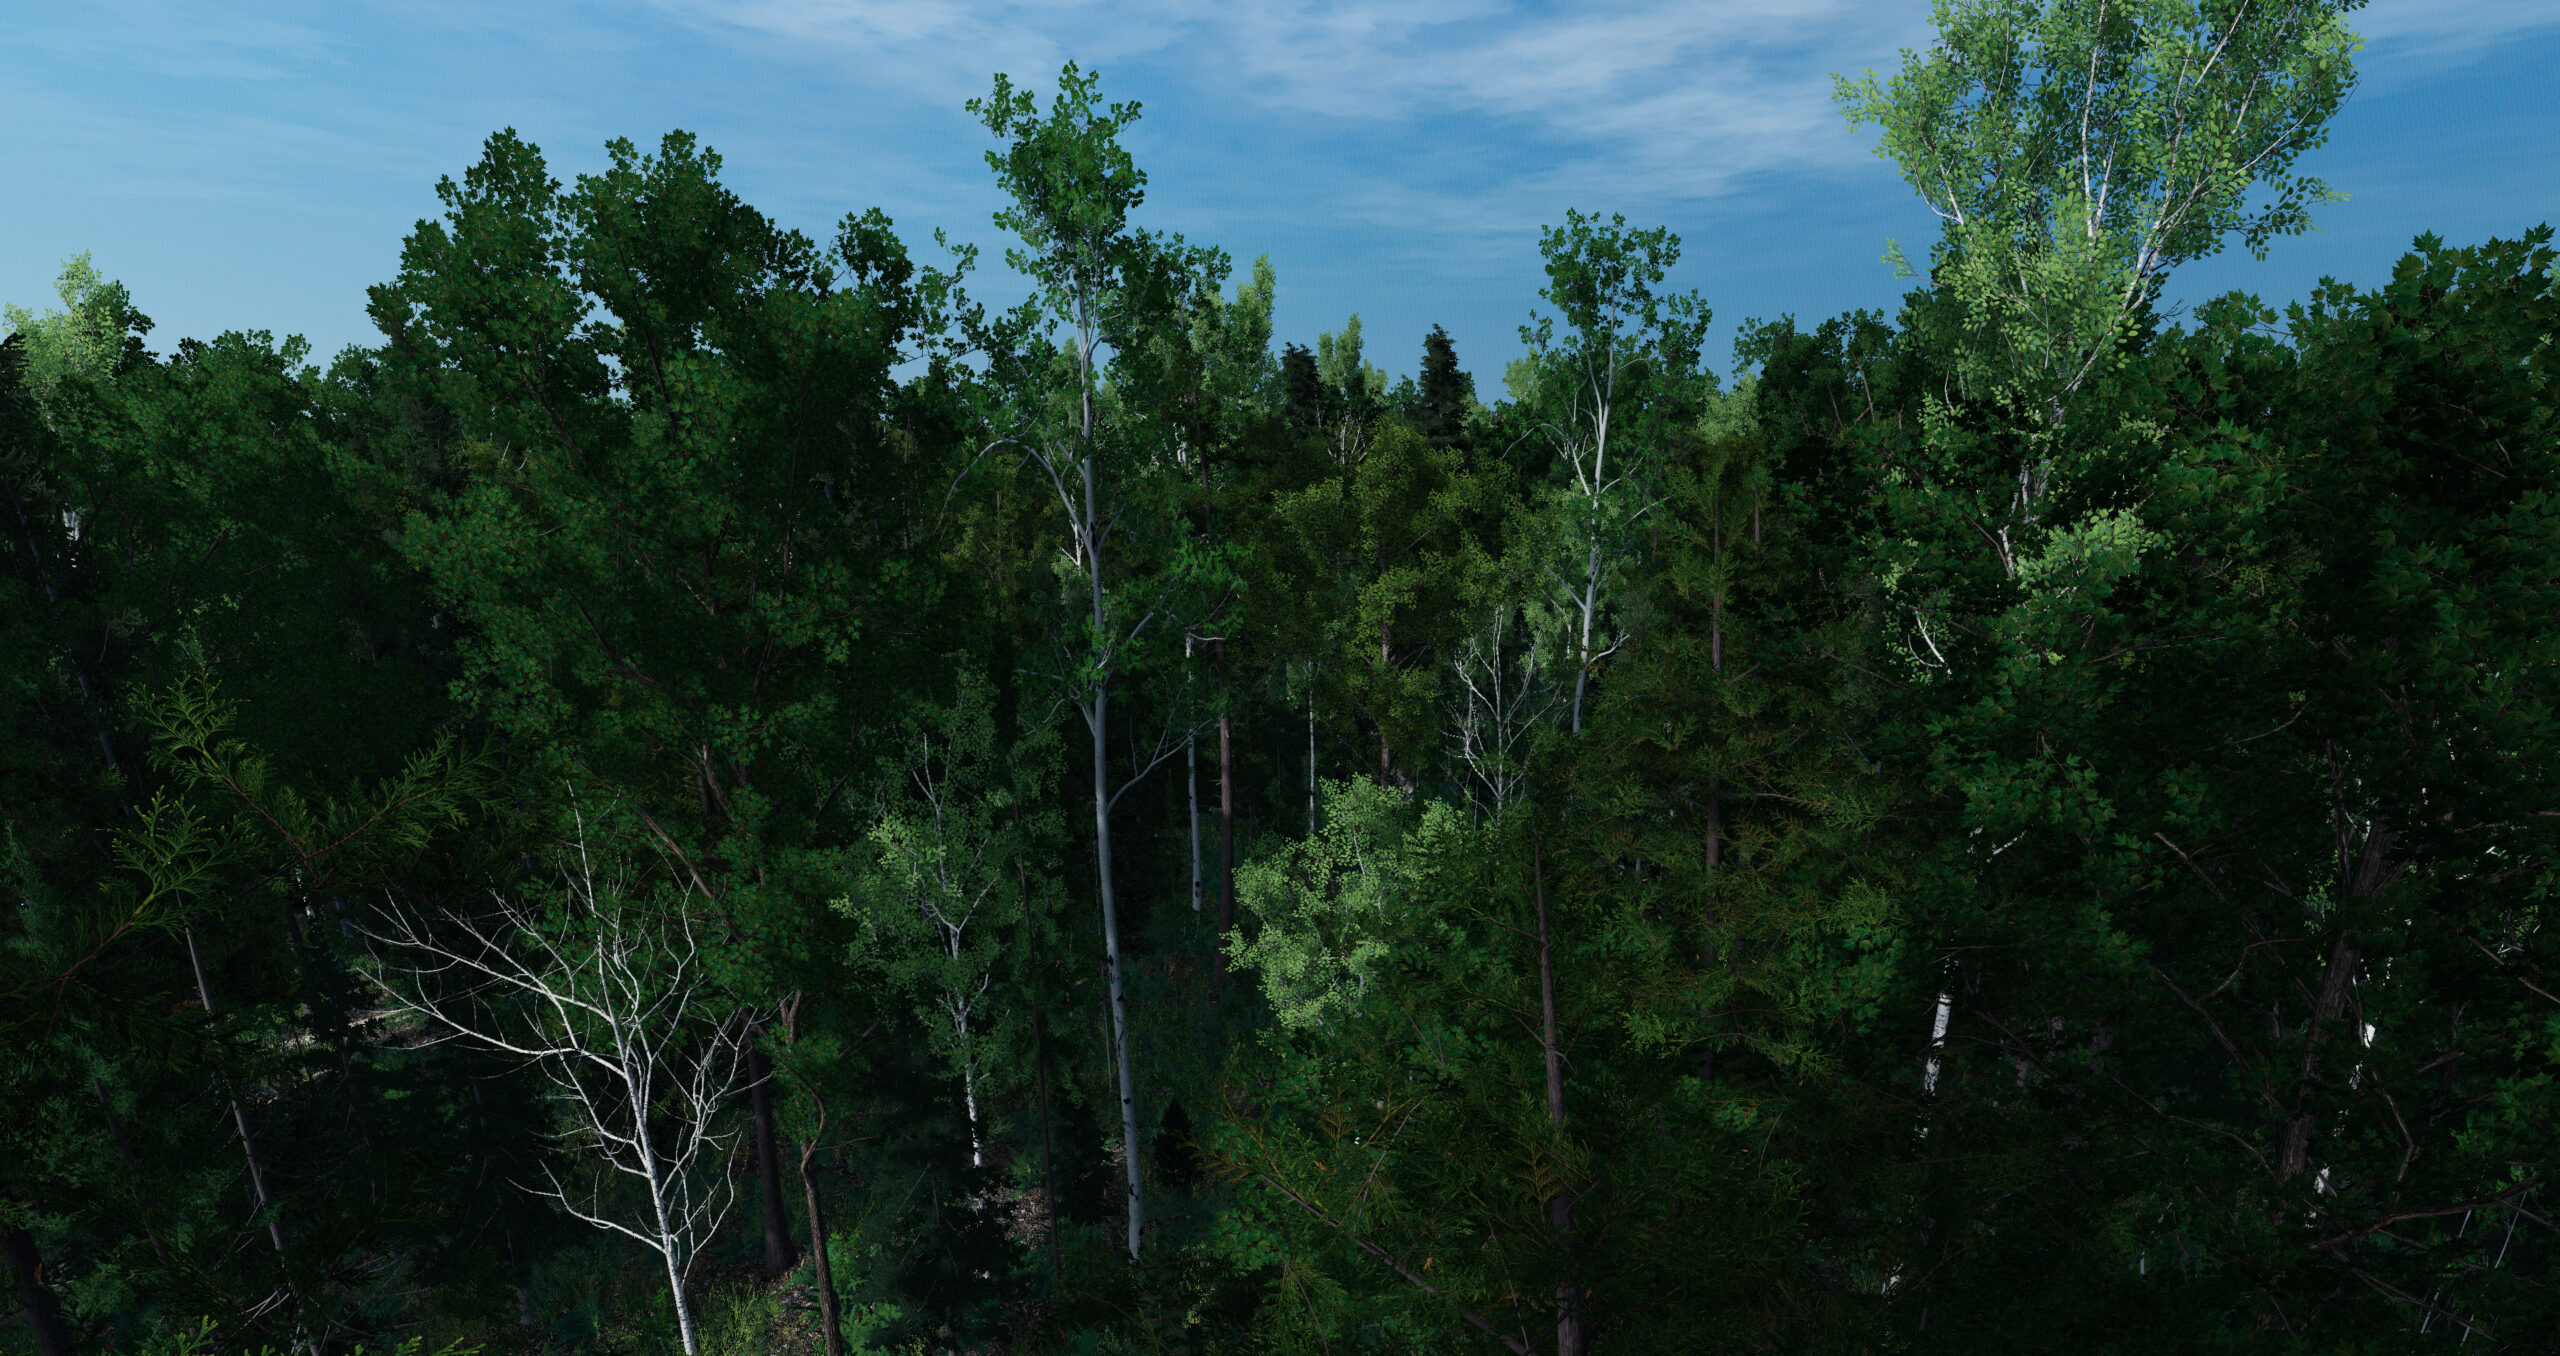
by: David Anderson

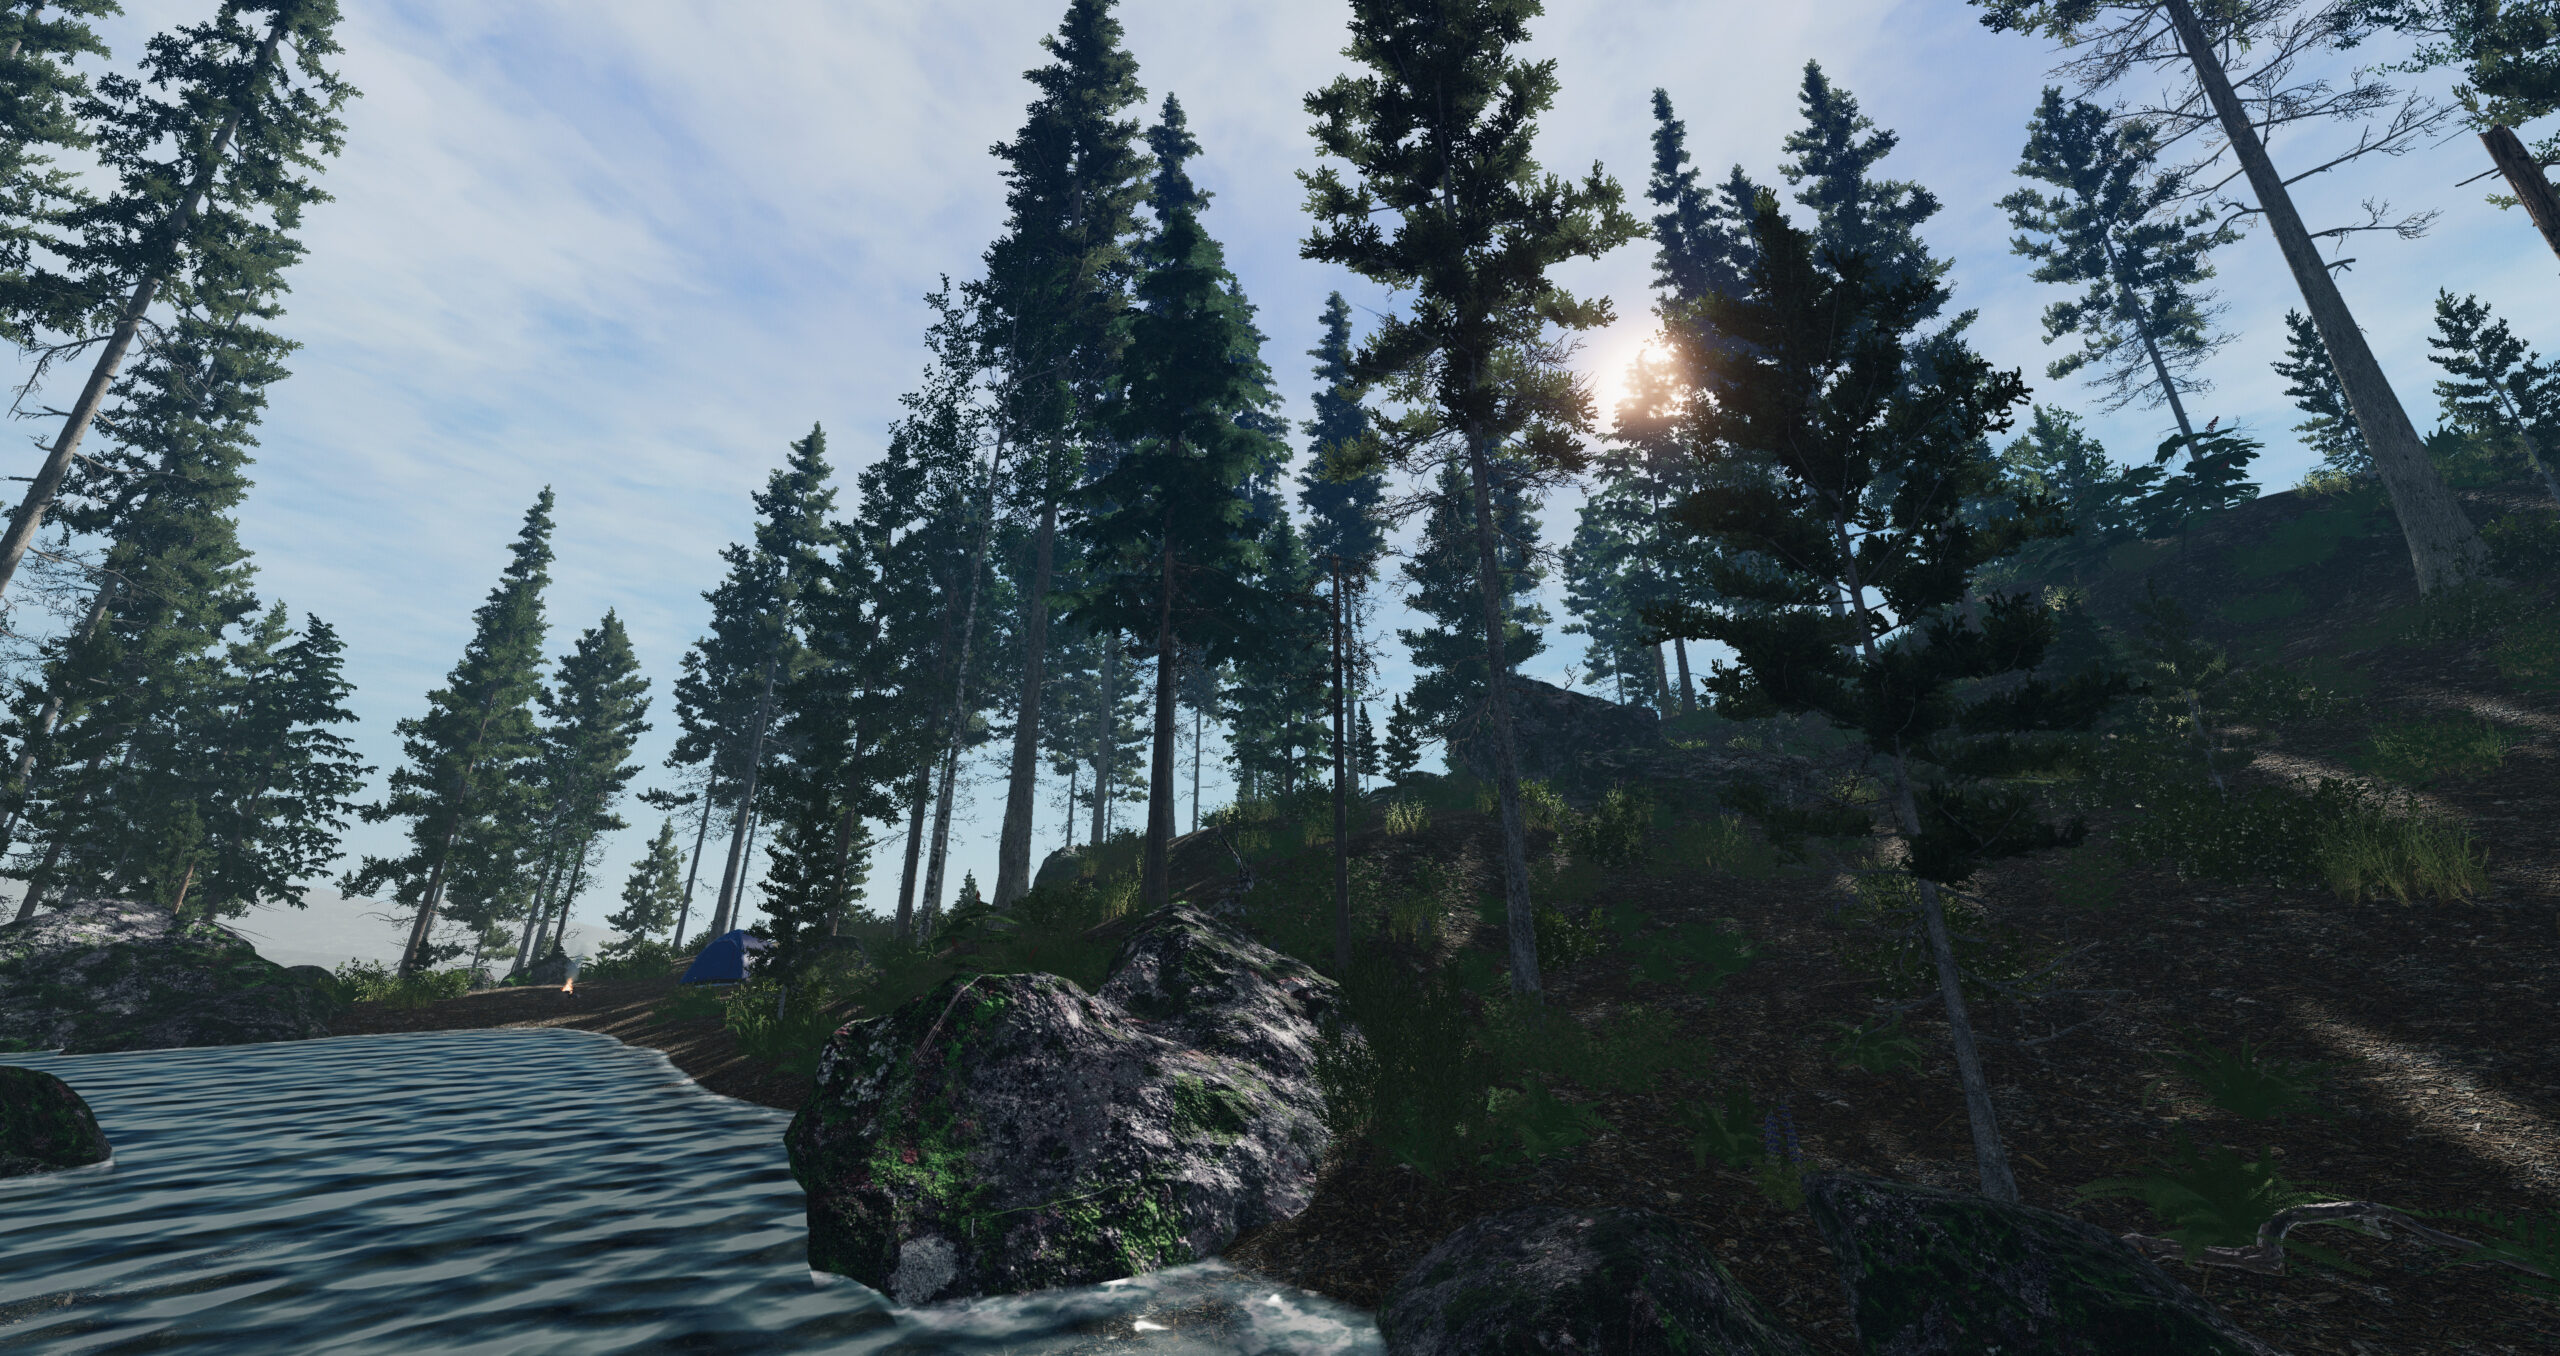
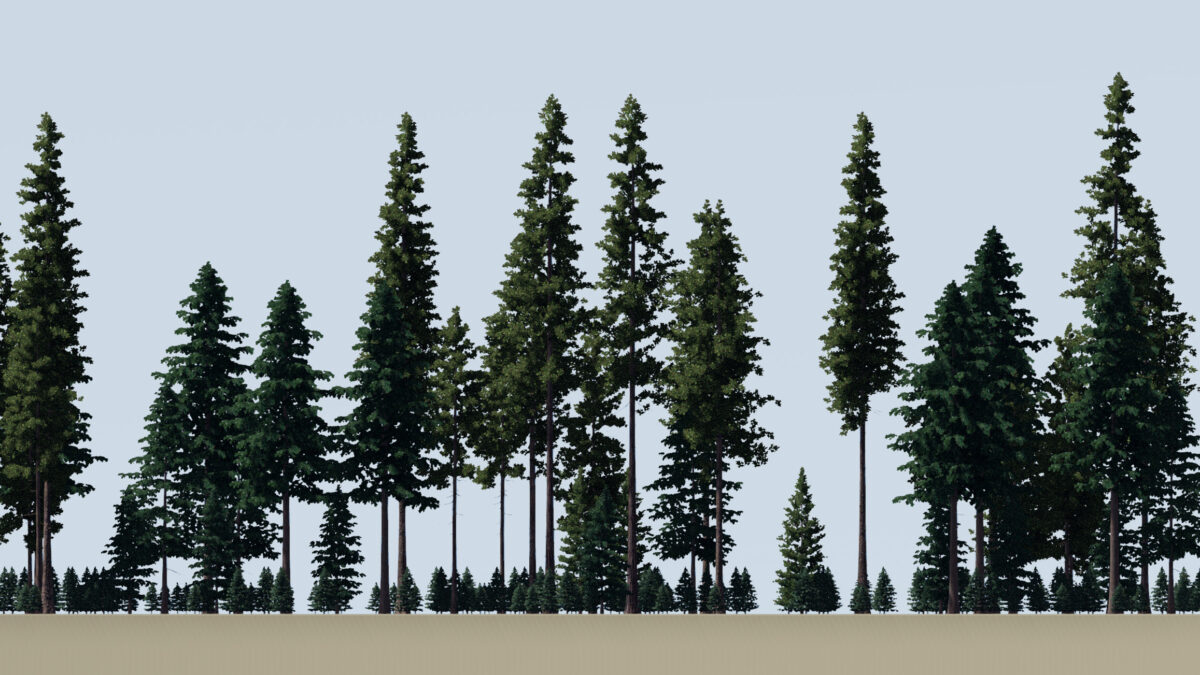
Some nice foliage.
Image 1:
Image 2:

Updated Tree Model List
Conifers:
Ponderosa Pine, Sugar Pine, Lodgepole Pine, Incense-Cedar, Western Redcedar, Giant Sequoia, Coast Redwood, Western Juniper, Western Hemlock, White Fir, Douglas-Fir, Engelmann Spruce, Western Larch, Loblolly Pine, Sitka Spruce.
Hardwoods
California Black Oak, Tanoak, Bigleaf Maple, Red Alder, Quaking Aspen, Dogwood, Curl-Leaf Mountain Mahogany, Vine Maple, Pacific Willow, Paper Birch, Red Maple, White Oak, Yellow Birch, Pignut Hickory, Sweetgum, American Beech, Sugar Maple.
All models can be used as visual substitutes for other species while reporting accurate names and data.
FVS Integration
We have expanded our FVS integration to work with models from across the country. The process remains the same, import your FVS Out file, select Run and Stand, hit prepare sequence, and let Stand Designer do the rest.
See more pictures below!
Stand Designer’s latest update has something for everyone.
Location-Based Terrains
Build stands on your specific topography, with one of our best features yet. From the Terrain menu, choose ‘Custom’ and enter a Latitude and Longitude for your stand. Stand Designer will automatically construct a 4-acre terrain using the best available data from USGS.
Import/Export Options
• New “tree list” and “stem map” table import formats for high detail data.
• Import tree records as “green”, “snag”, or “stump”.
• Import tree heights and custom values for tree volume and biomass.
• Auto-generate tree locations or specify your own x,y positions based on LiDAR, drones, or custom distribution algorithms.
• Distribute trees in a scene in Stand Designer, then export a stem map that you can work with in GIS or other software tools.
• Apply your own custom procedures for marking “harvest trees”, then import the data back to Stand Designer for visualization.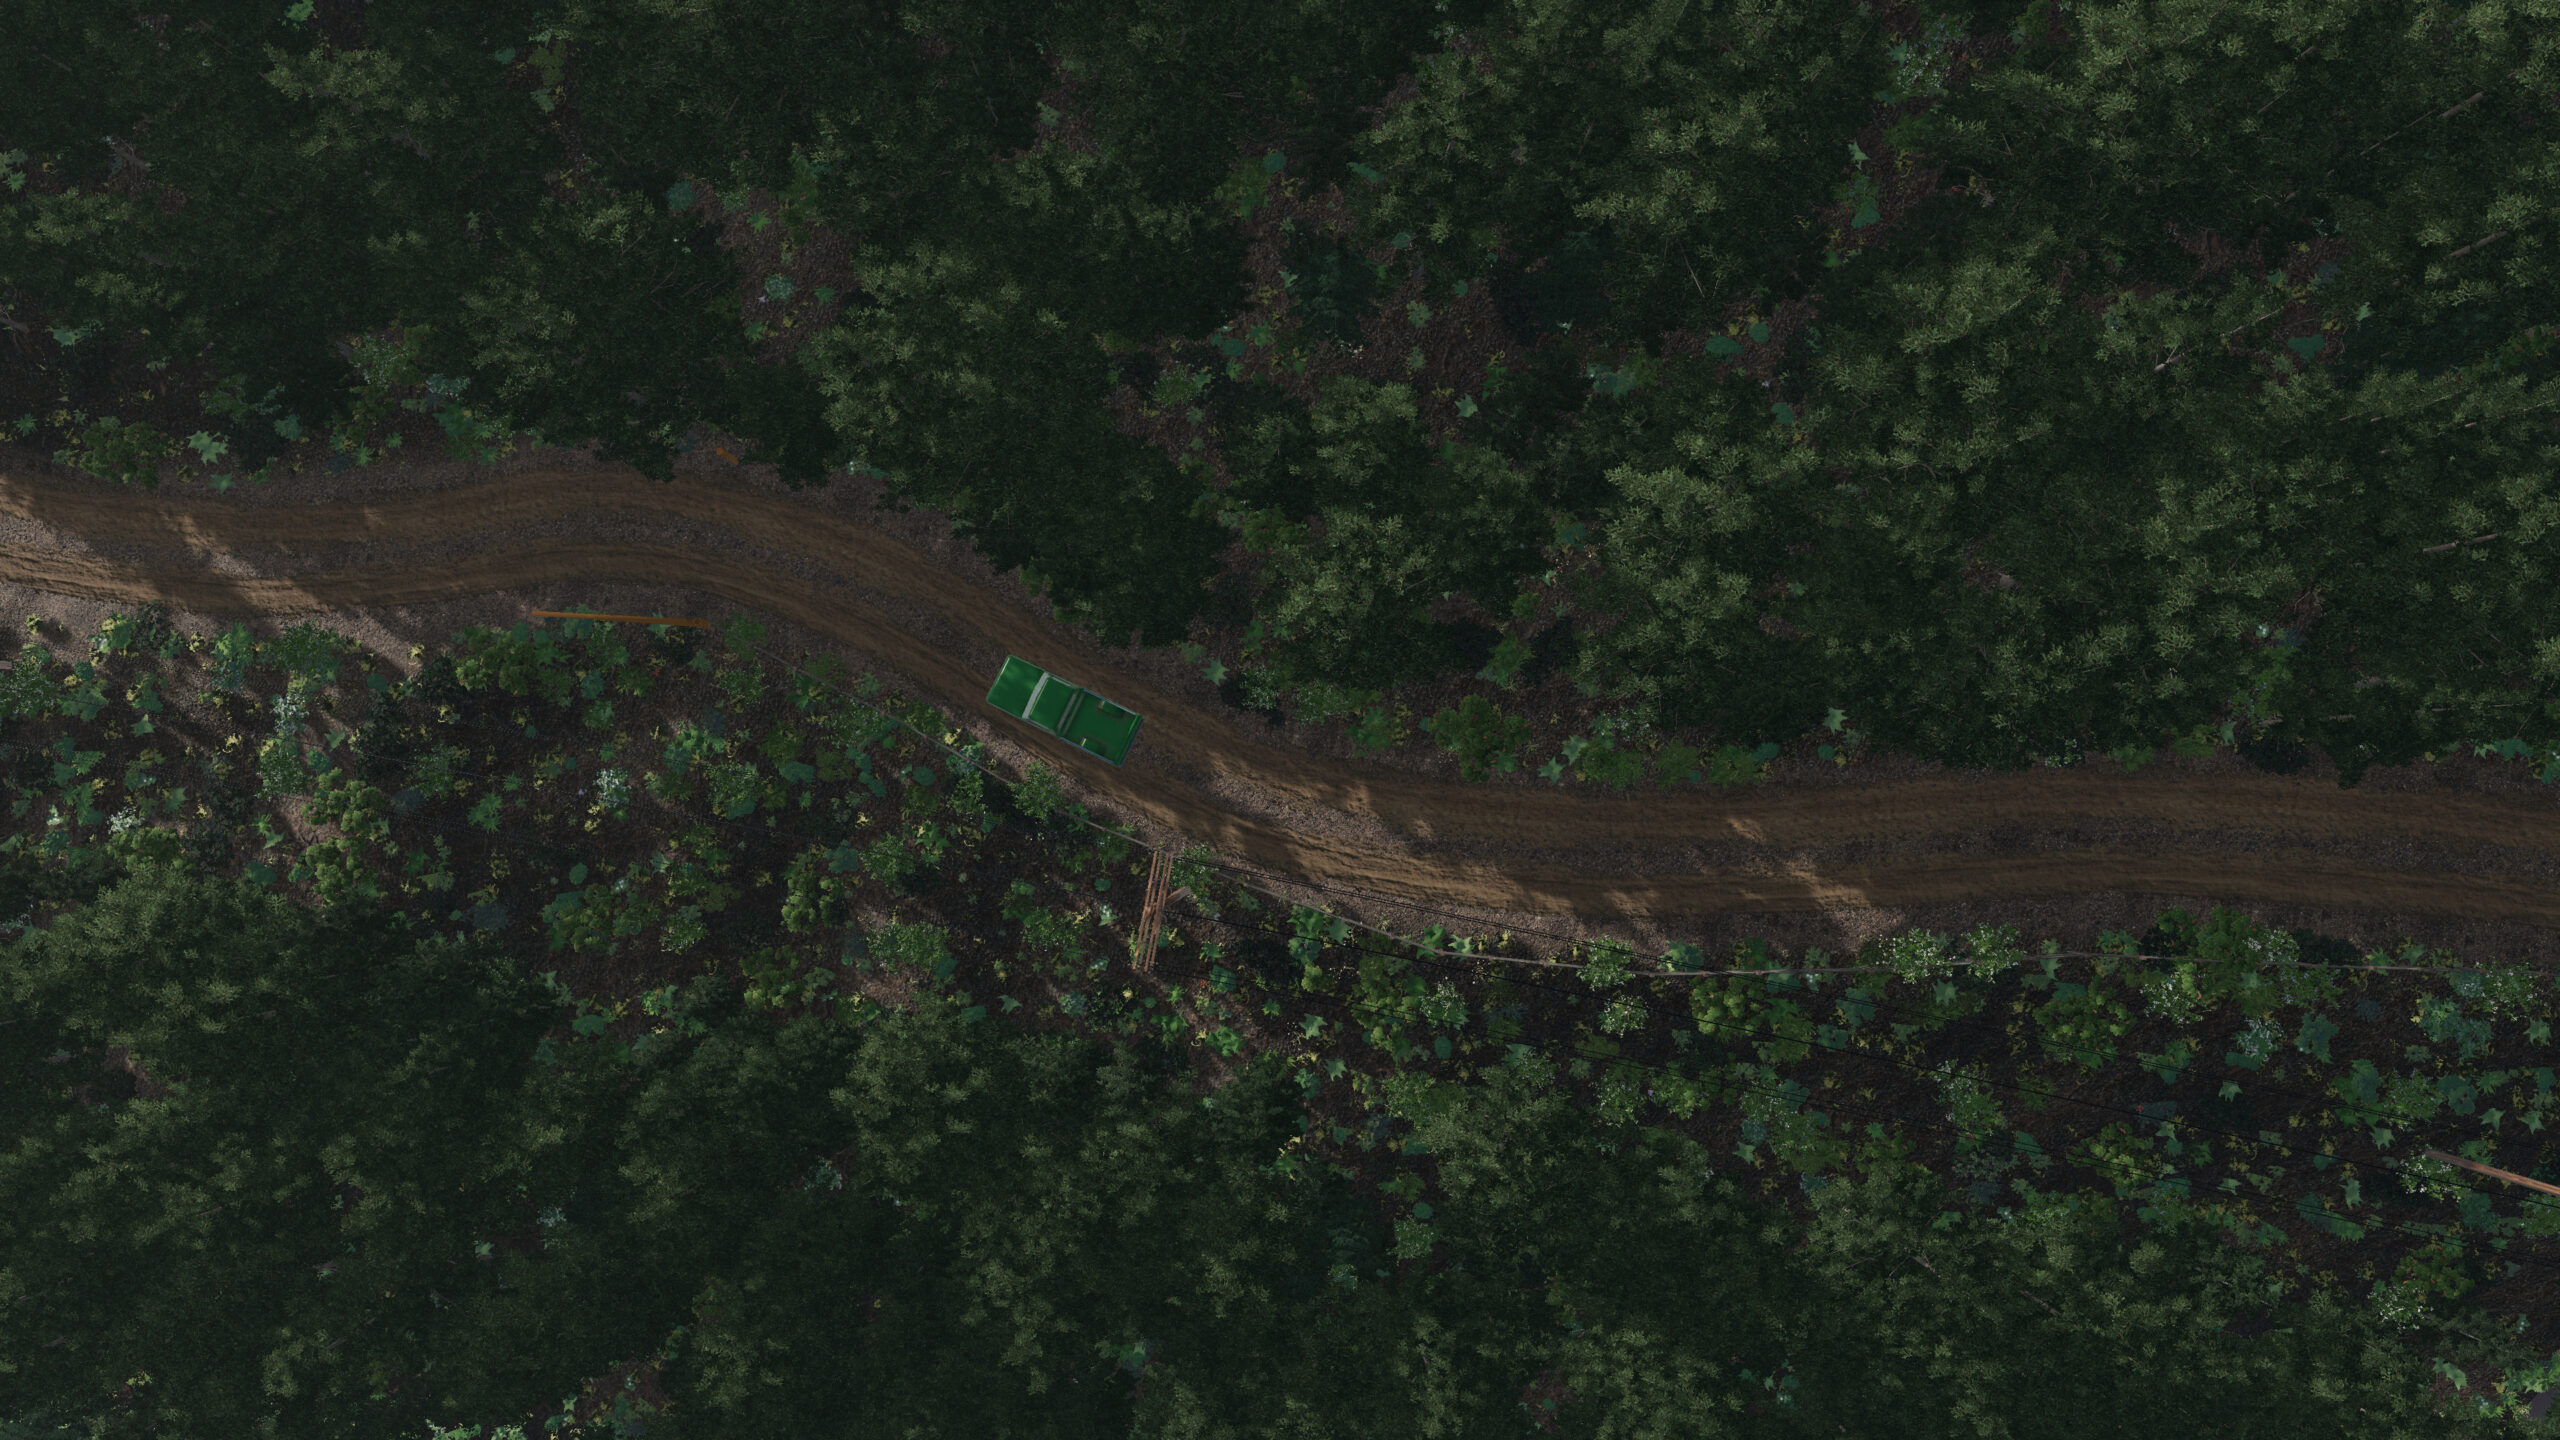
Metric
To support growing interest from outside of the United States, we decided it was time that they shouldn’t be stuck using our measurement system. Simply check the ‘Metric’ box in the general settings tab to convert over throughout the application.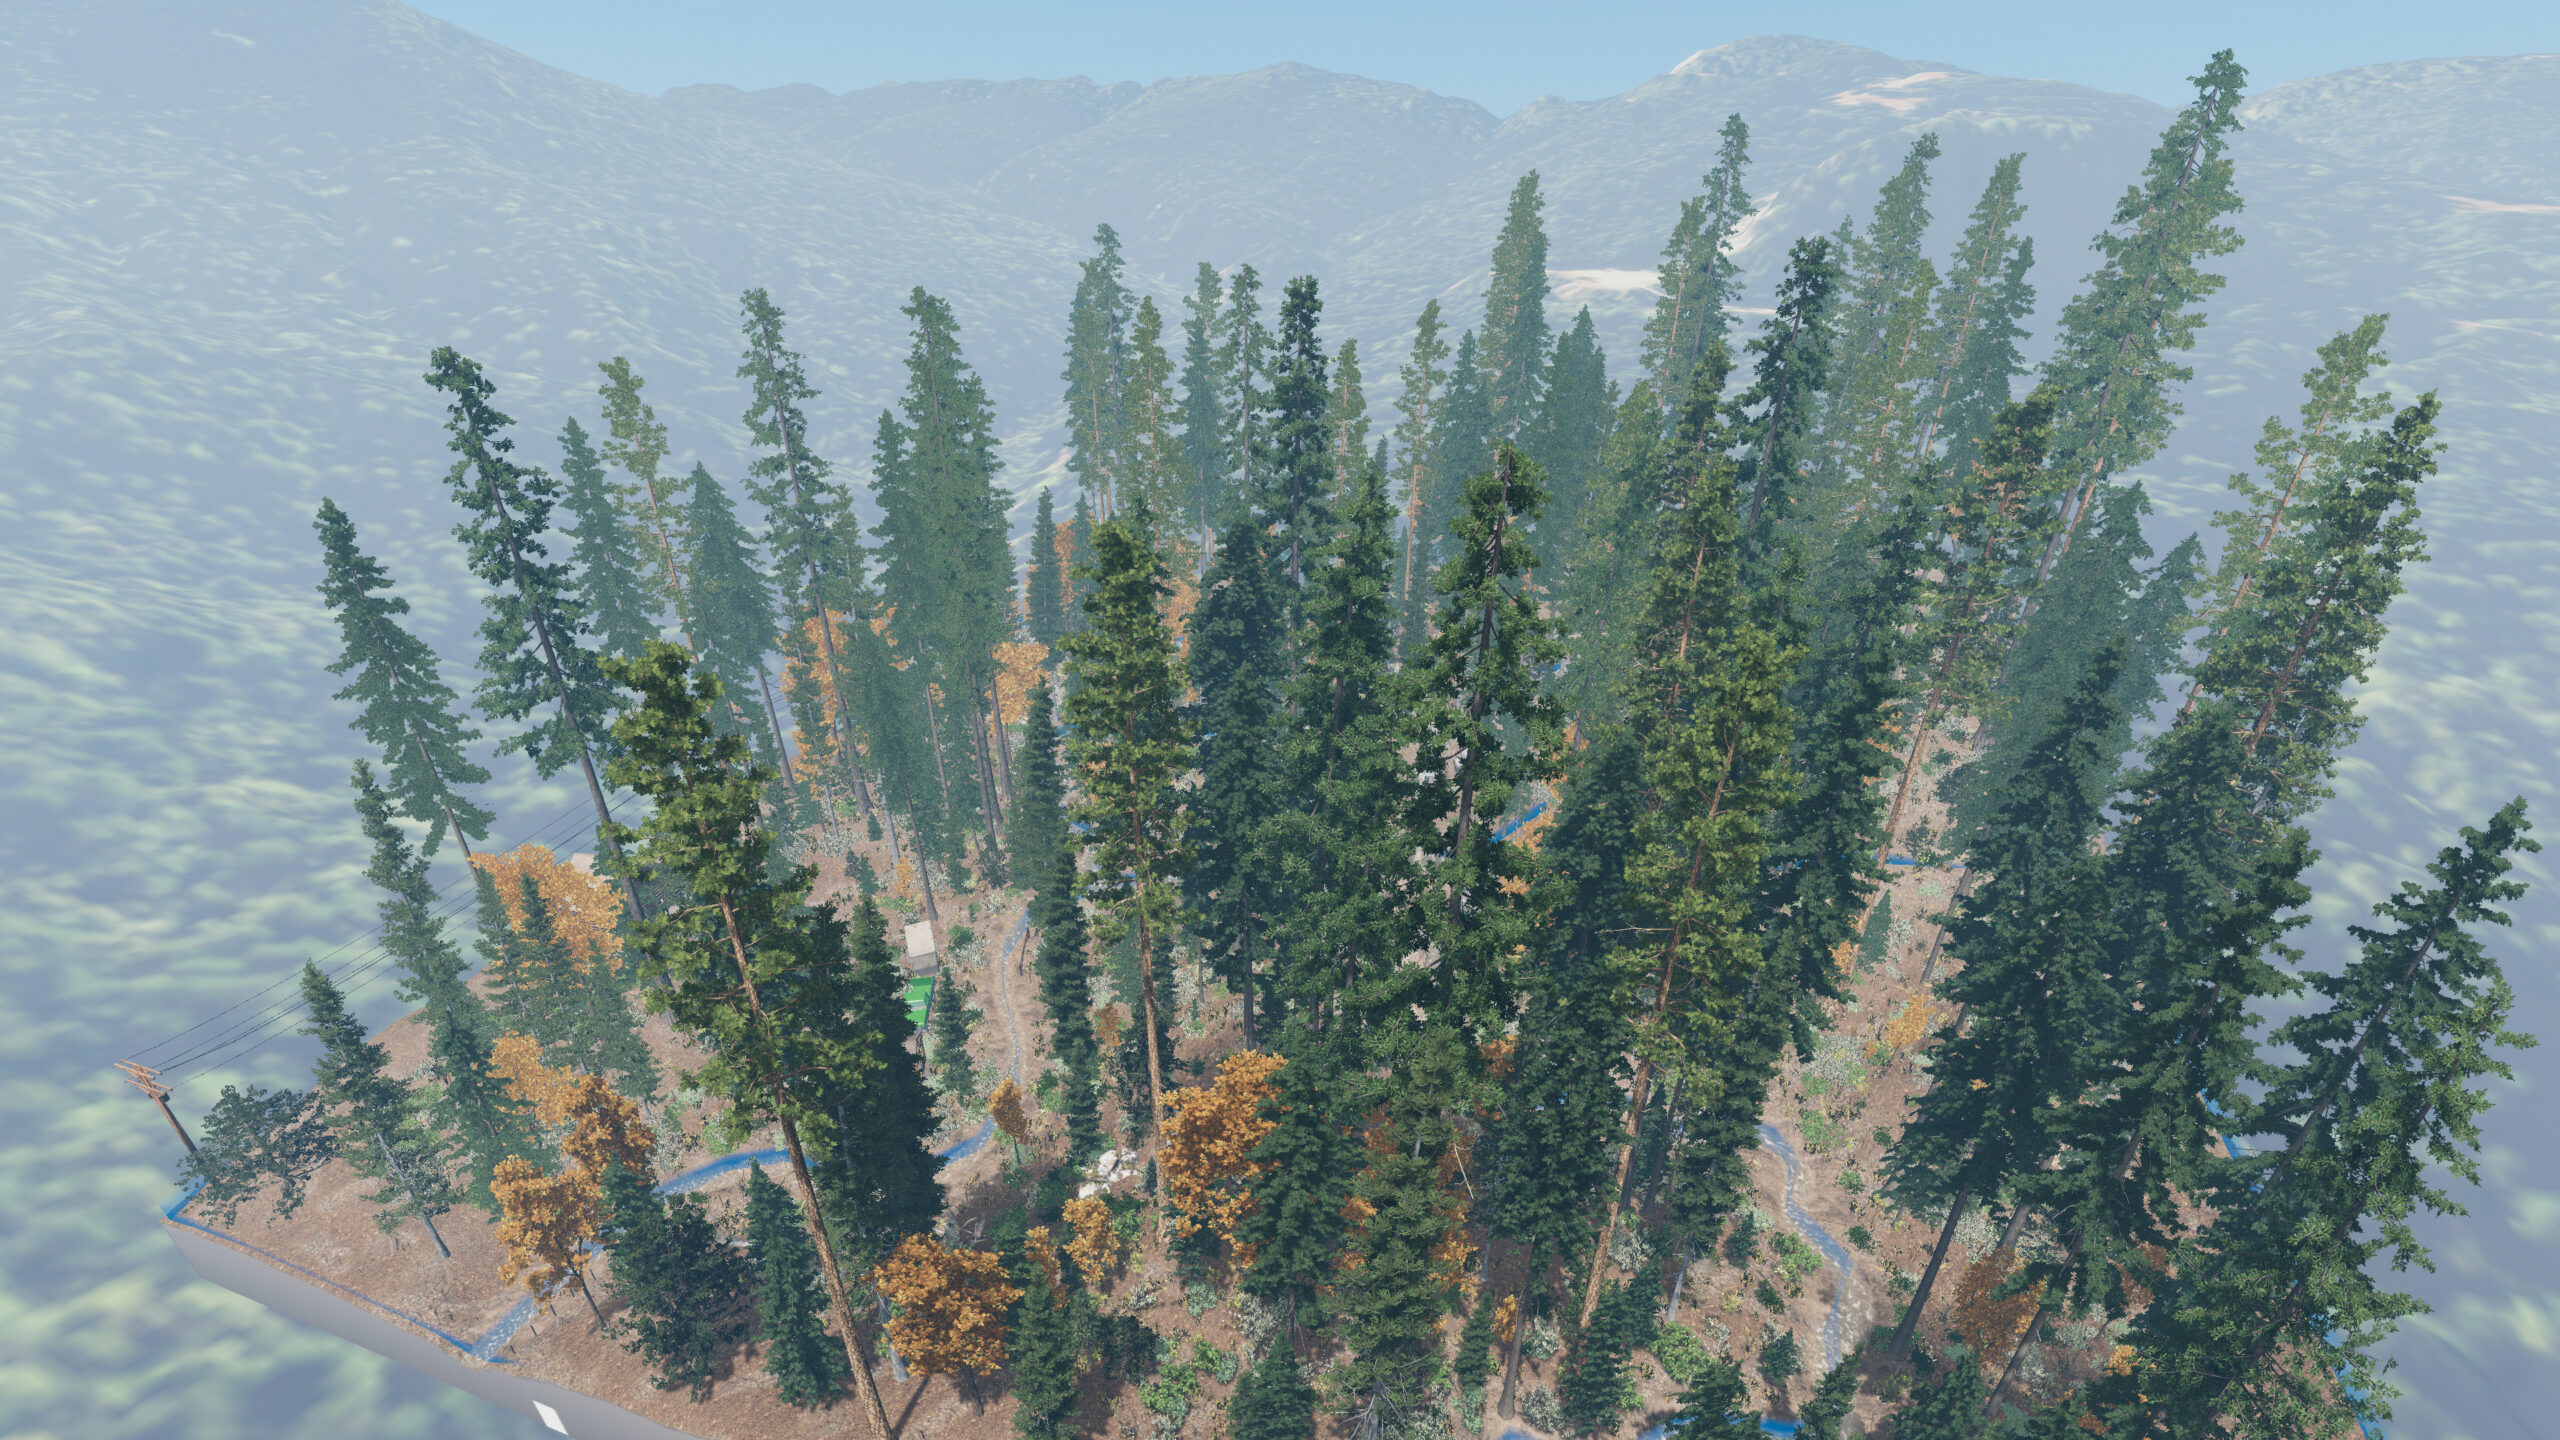
Sitka Spruce and Dozens of New Objects
Introducing our newest and most popularly requested species, as well as objects including a modern home, utility poles, road gates, trucks, woodchipper, feller buncher, fencing and more.
Large databases of measurements from the field are a powerful tool to understand forest conditions, forest trends, and variations across an ownership or region. This information is essential to understanding the ecological, economic, and cultural resources a forest can provide–both in the present and in the future.
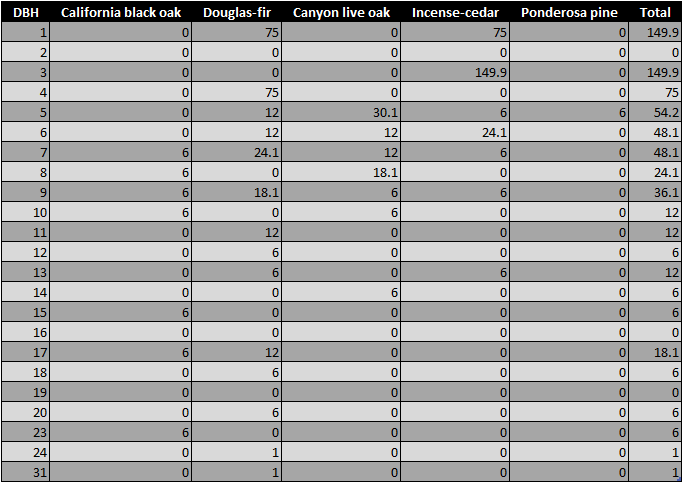
However, it can be intimidating to browse these databases, look for answers, and attempt to convey information. It is certainly easy to get lost in the numbers and it can take years to develop the frame of reference needed to understand forestry data. We can do some math and describe a stand in terms of basal area per acre, quadratic mean diameter, and stand density index, but what do these values mean? We can describe forest structure and composition using a stand table, but can you picture this stand in your mind just by looking at the table below? Is the picture in your mind the same as that of your colleagues?
In this blog post, we will explore one way to make forest inventory data more accessible and more engaging using forest visualizations from Visual Forester: Stand Designer. This will allow you to convey and discuss your data and your management proposals with a much larger audience and will help to facilitate more productive conversations. Additionally, forest visualization is a great way to engage with students and show them forests across the country while teaching some statistics, data analysis, and observational skills along the way.
We could easily build visualizations from any forest inventory database, but for this example, we will use the database maintained by the Forest Service FIA program. The FIA (Forest Inventory and Analysis) database covers most of the forested parts of the U.S, contains very rich data at each plot, and is free to access. The FIA website includes some fact-sheets about America’s forests as well as some tools to auto-generate reports for particular areas and information types. Alternatively, you can download the full extent of the database and dive in yourself. Popular with researchers of many specialities, there are endless ways to utilize the information in the FIA database.
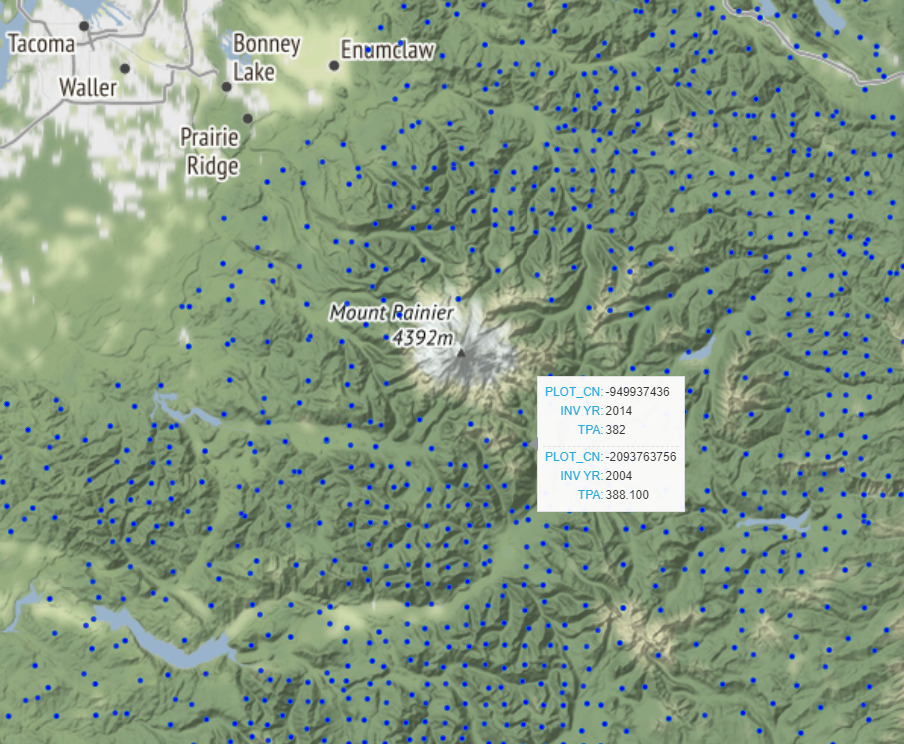
There are also numerous tools and methods available to extract information from big data sources like the FIA database. Many of these tools require some scripting/database skills. In this case, to make visualizations quick and easy, we created a simple stand-alone utility where you find plots on a map and type in the plot ID numbers to pick out data. The plot data is then automatically rearranged into a stand table that can be loaded straight into Stand Designer. You can find a link to download this application on the “Get More Data” page of the Stand Designer manual.
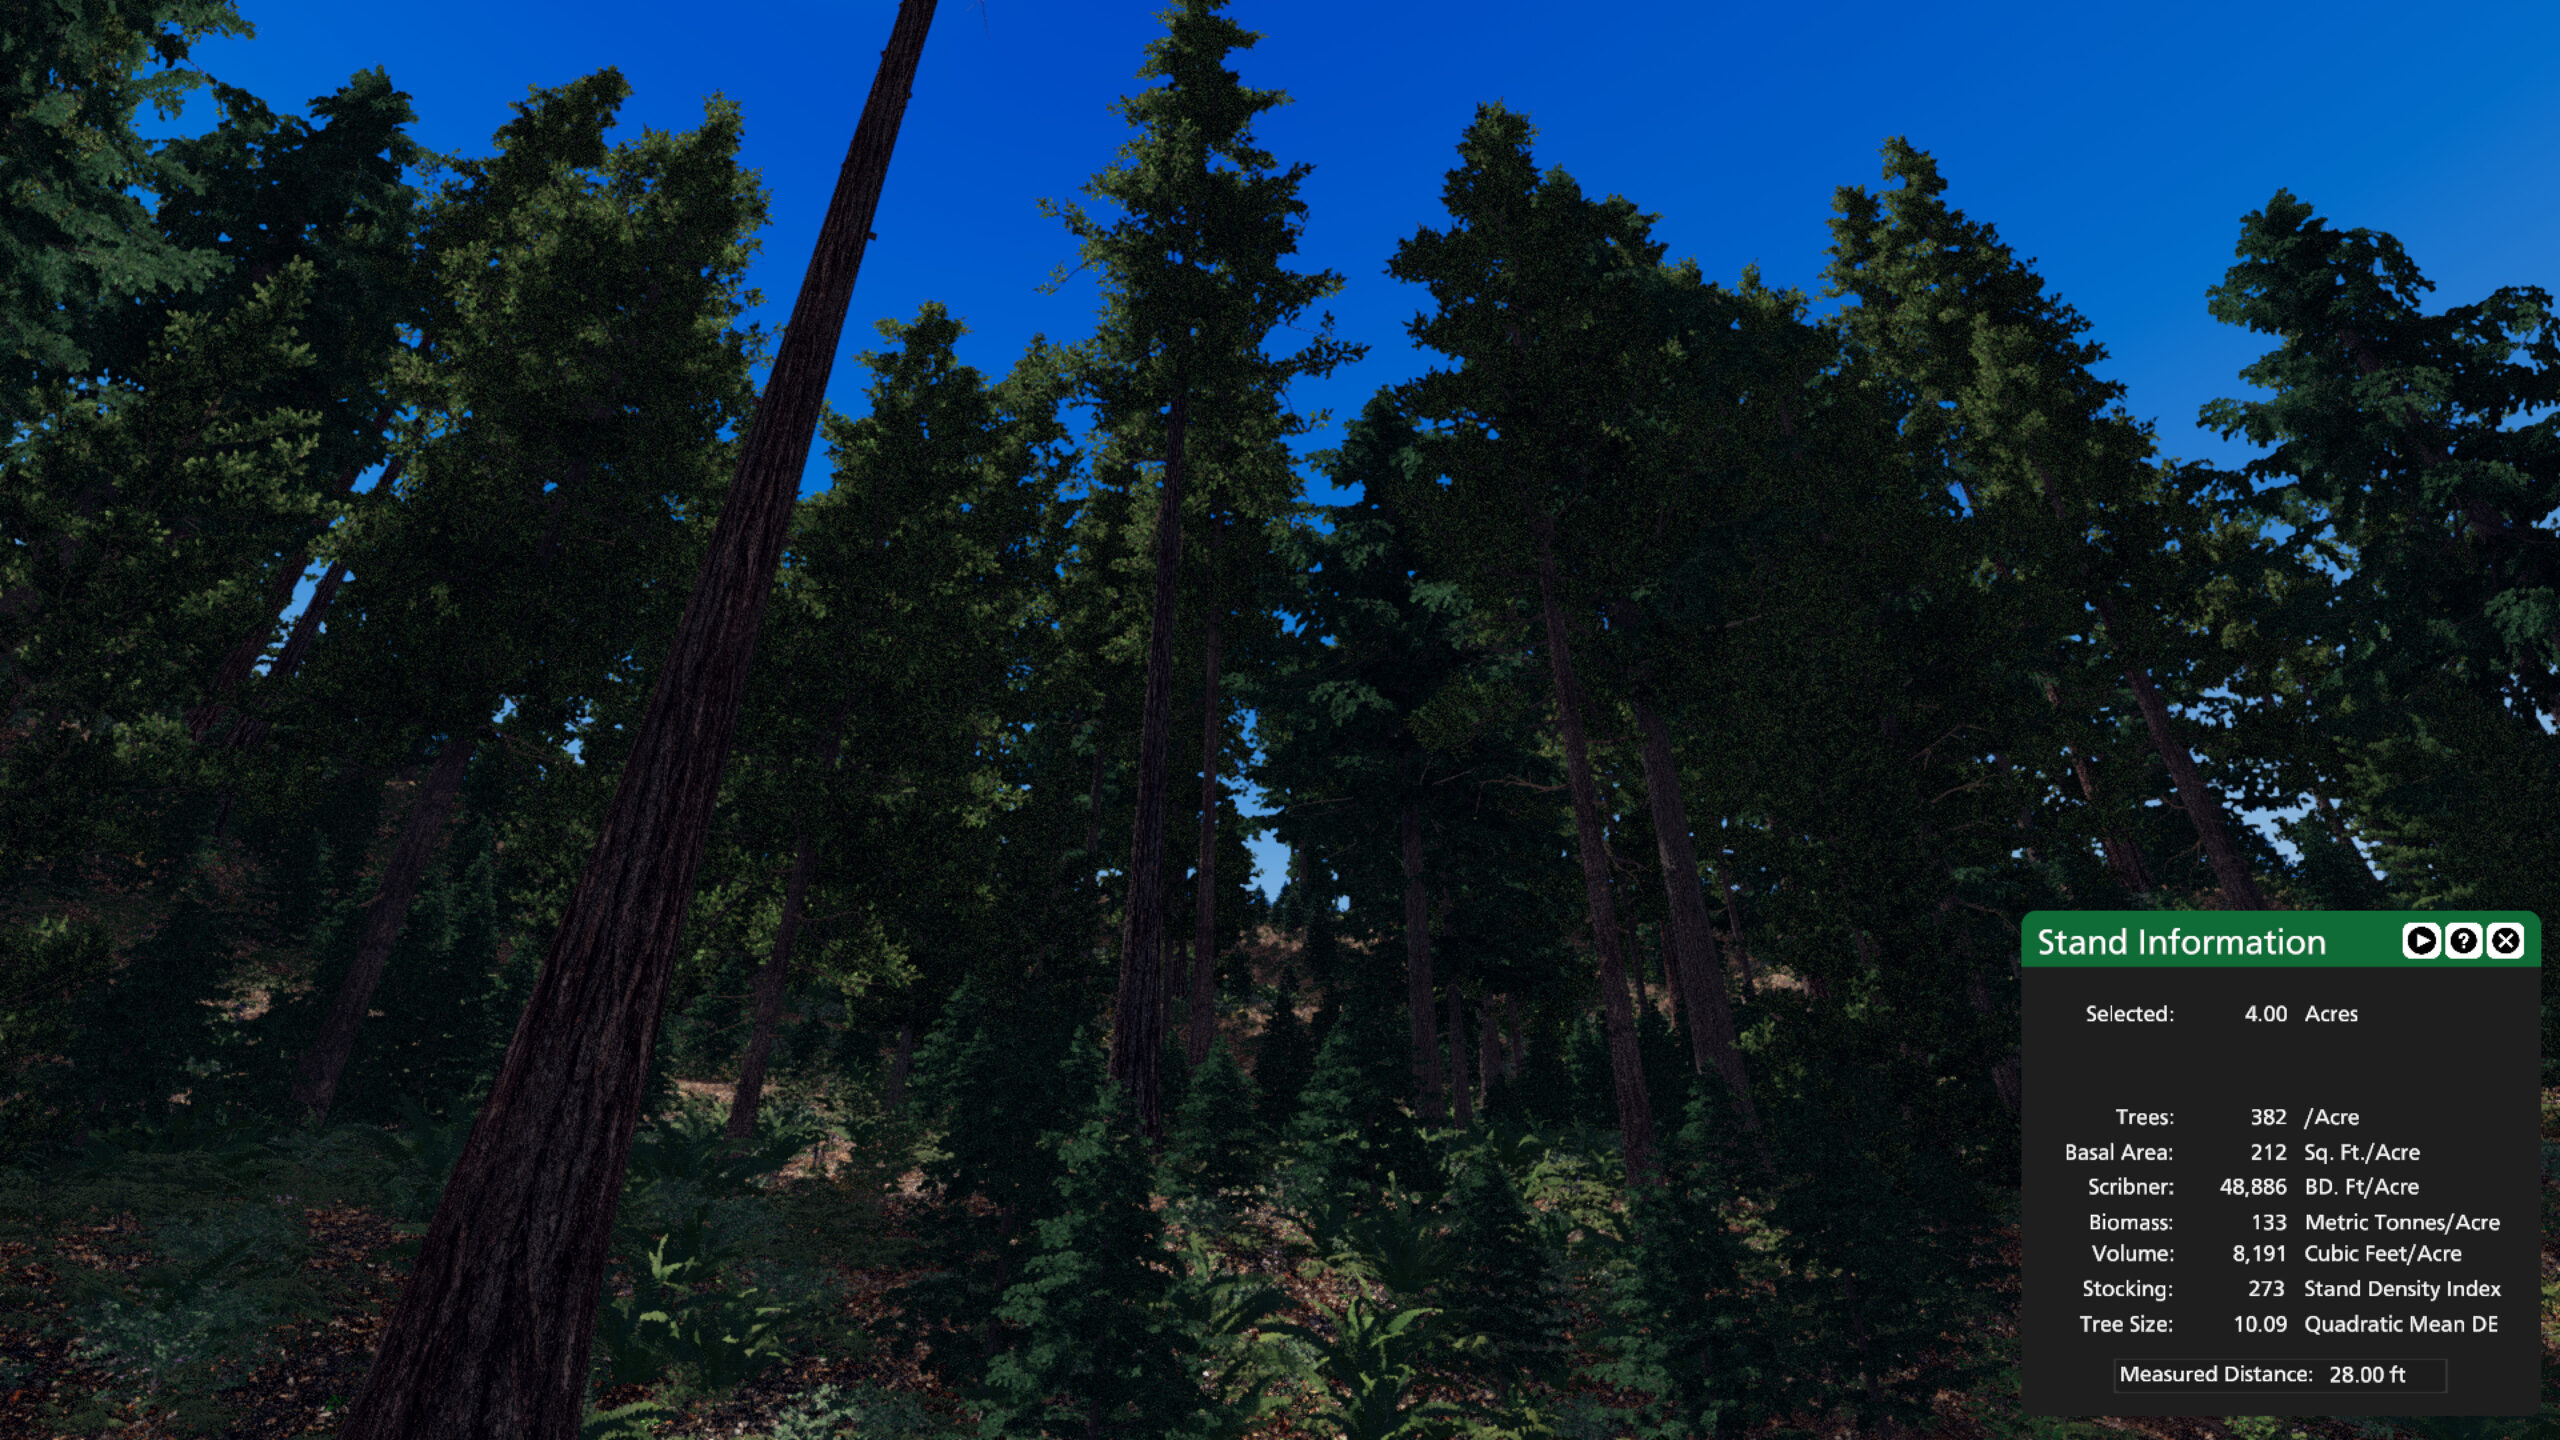
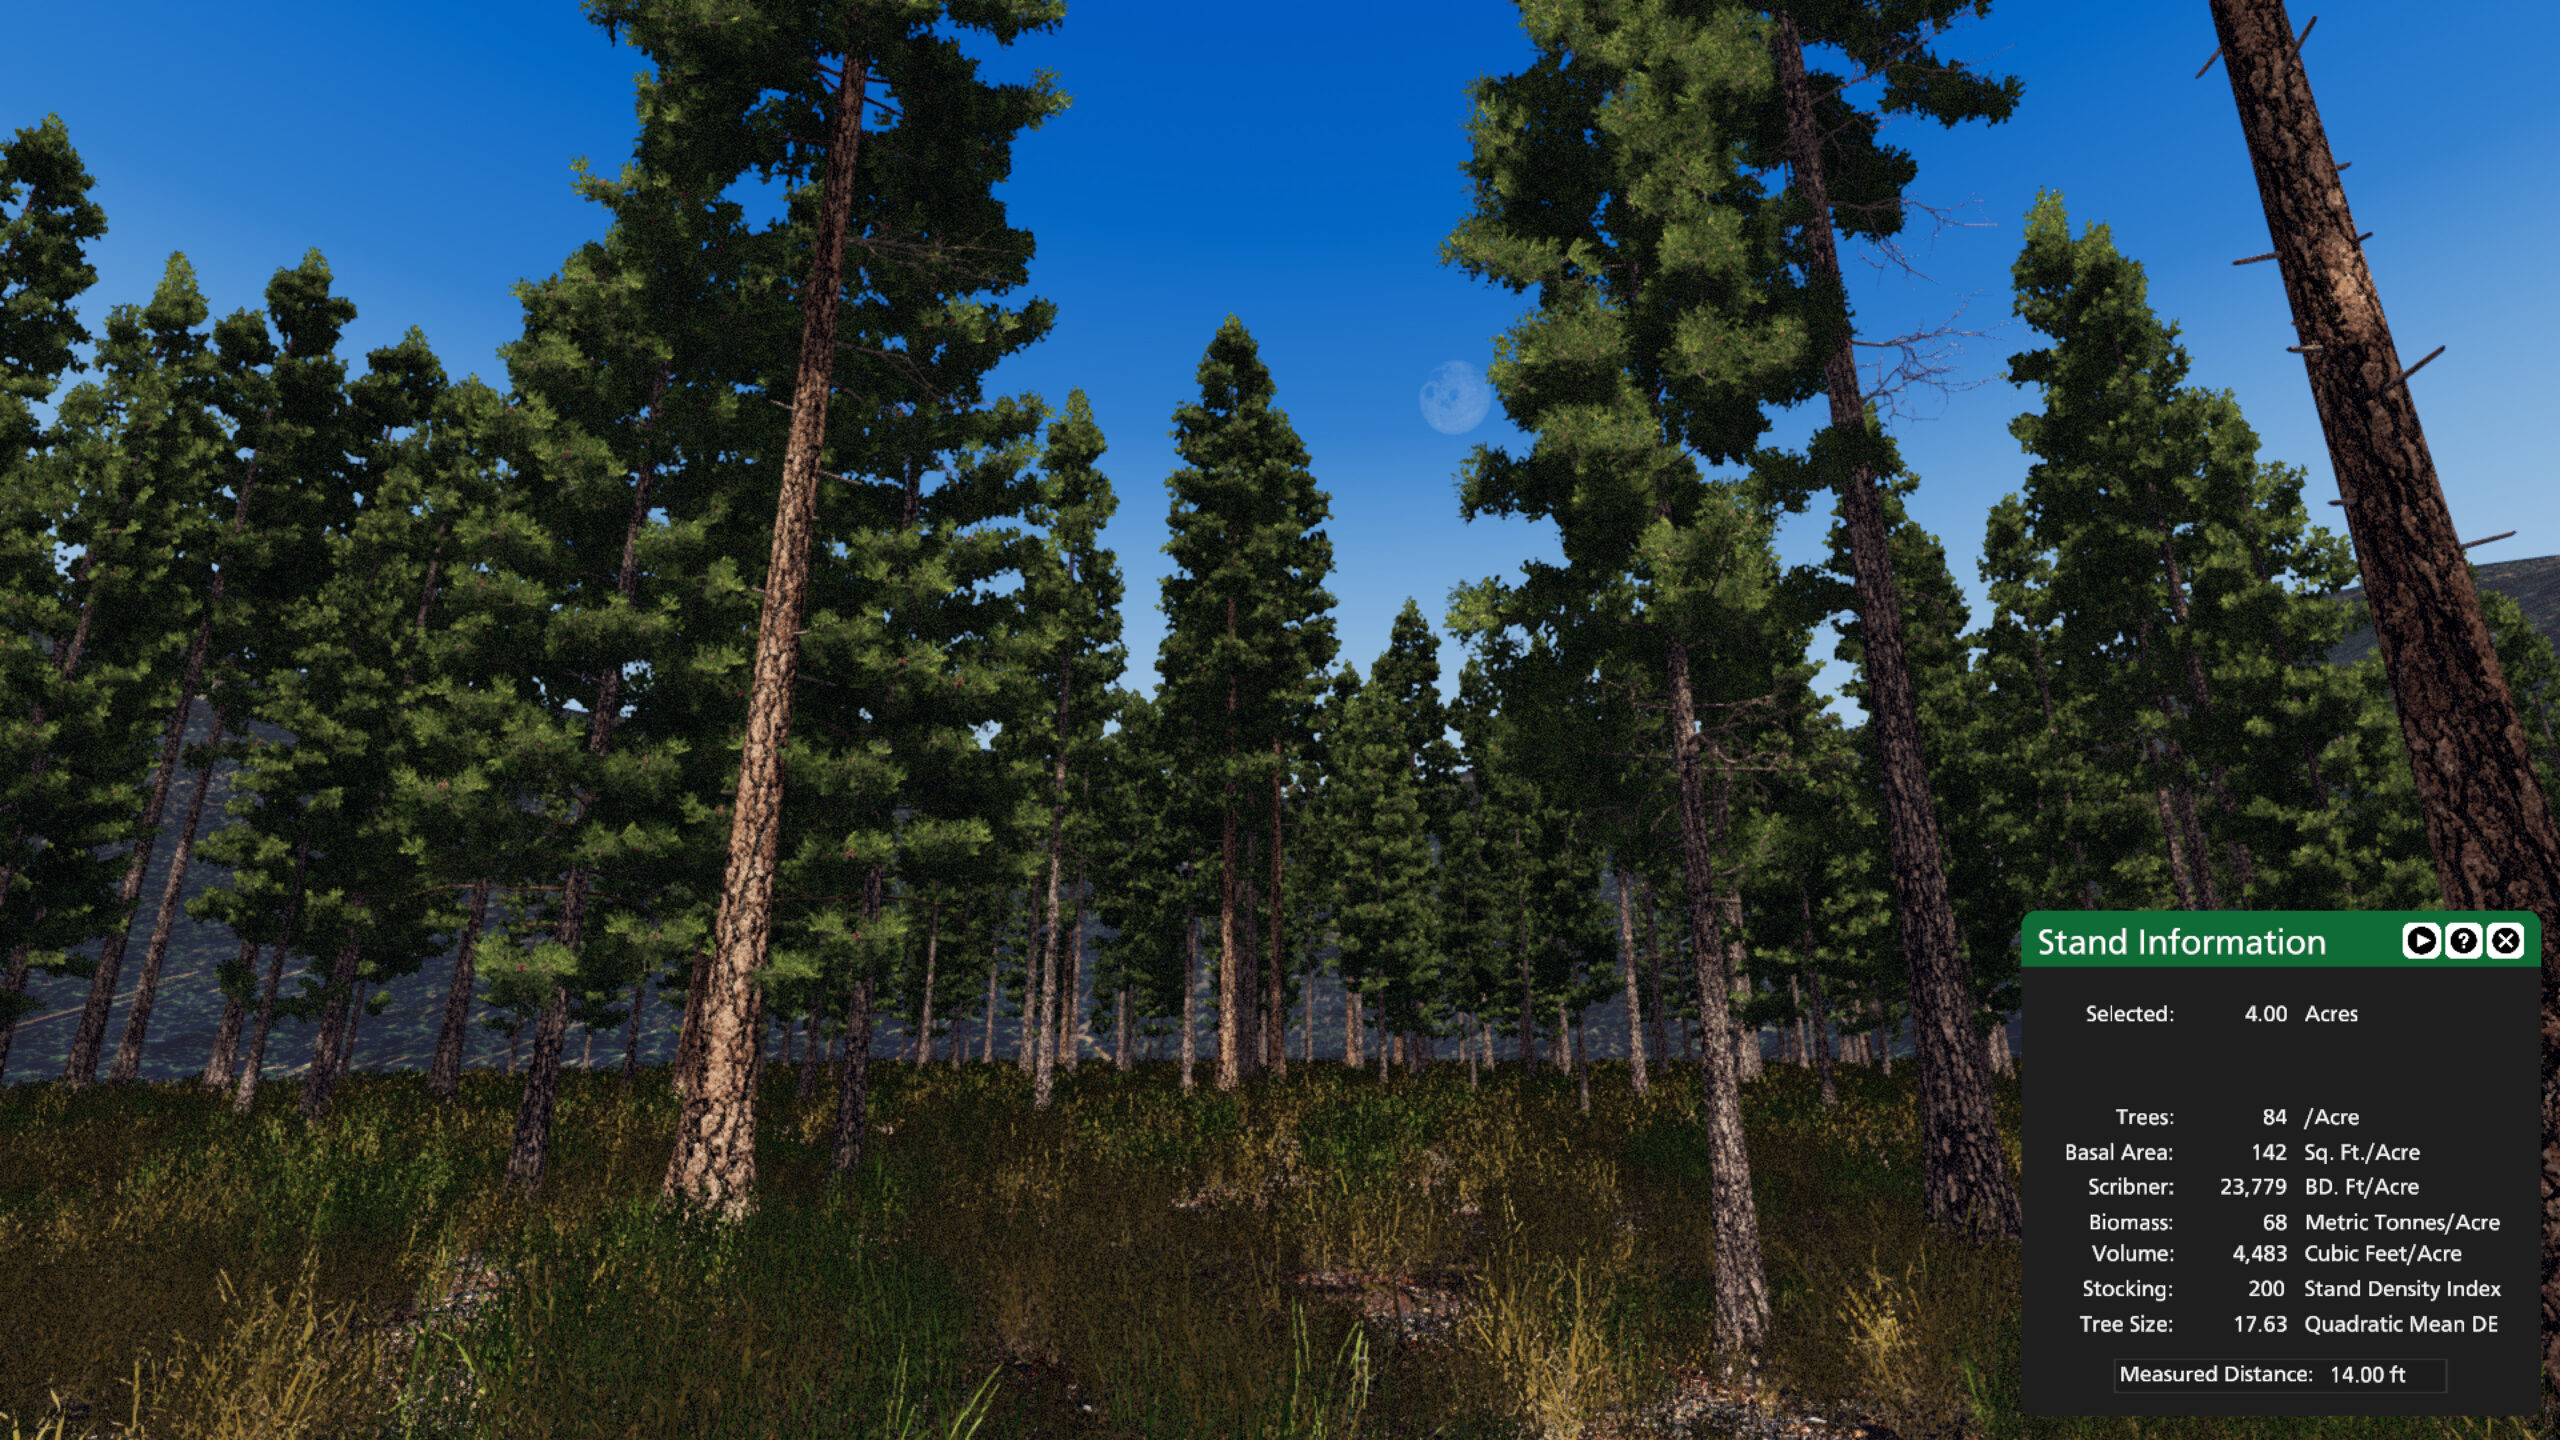
Using the utility above in conjunction with Stand Designer, it is possible to quickly build visualizations of any stand in the Western US that has been measured and recorded in the FIA database. Here are a few examples of other stands from around the west:
A mature ponderosa pine stand near Flagstaff, AZ
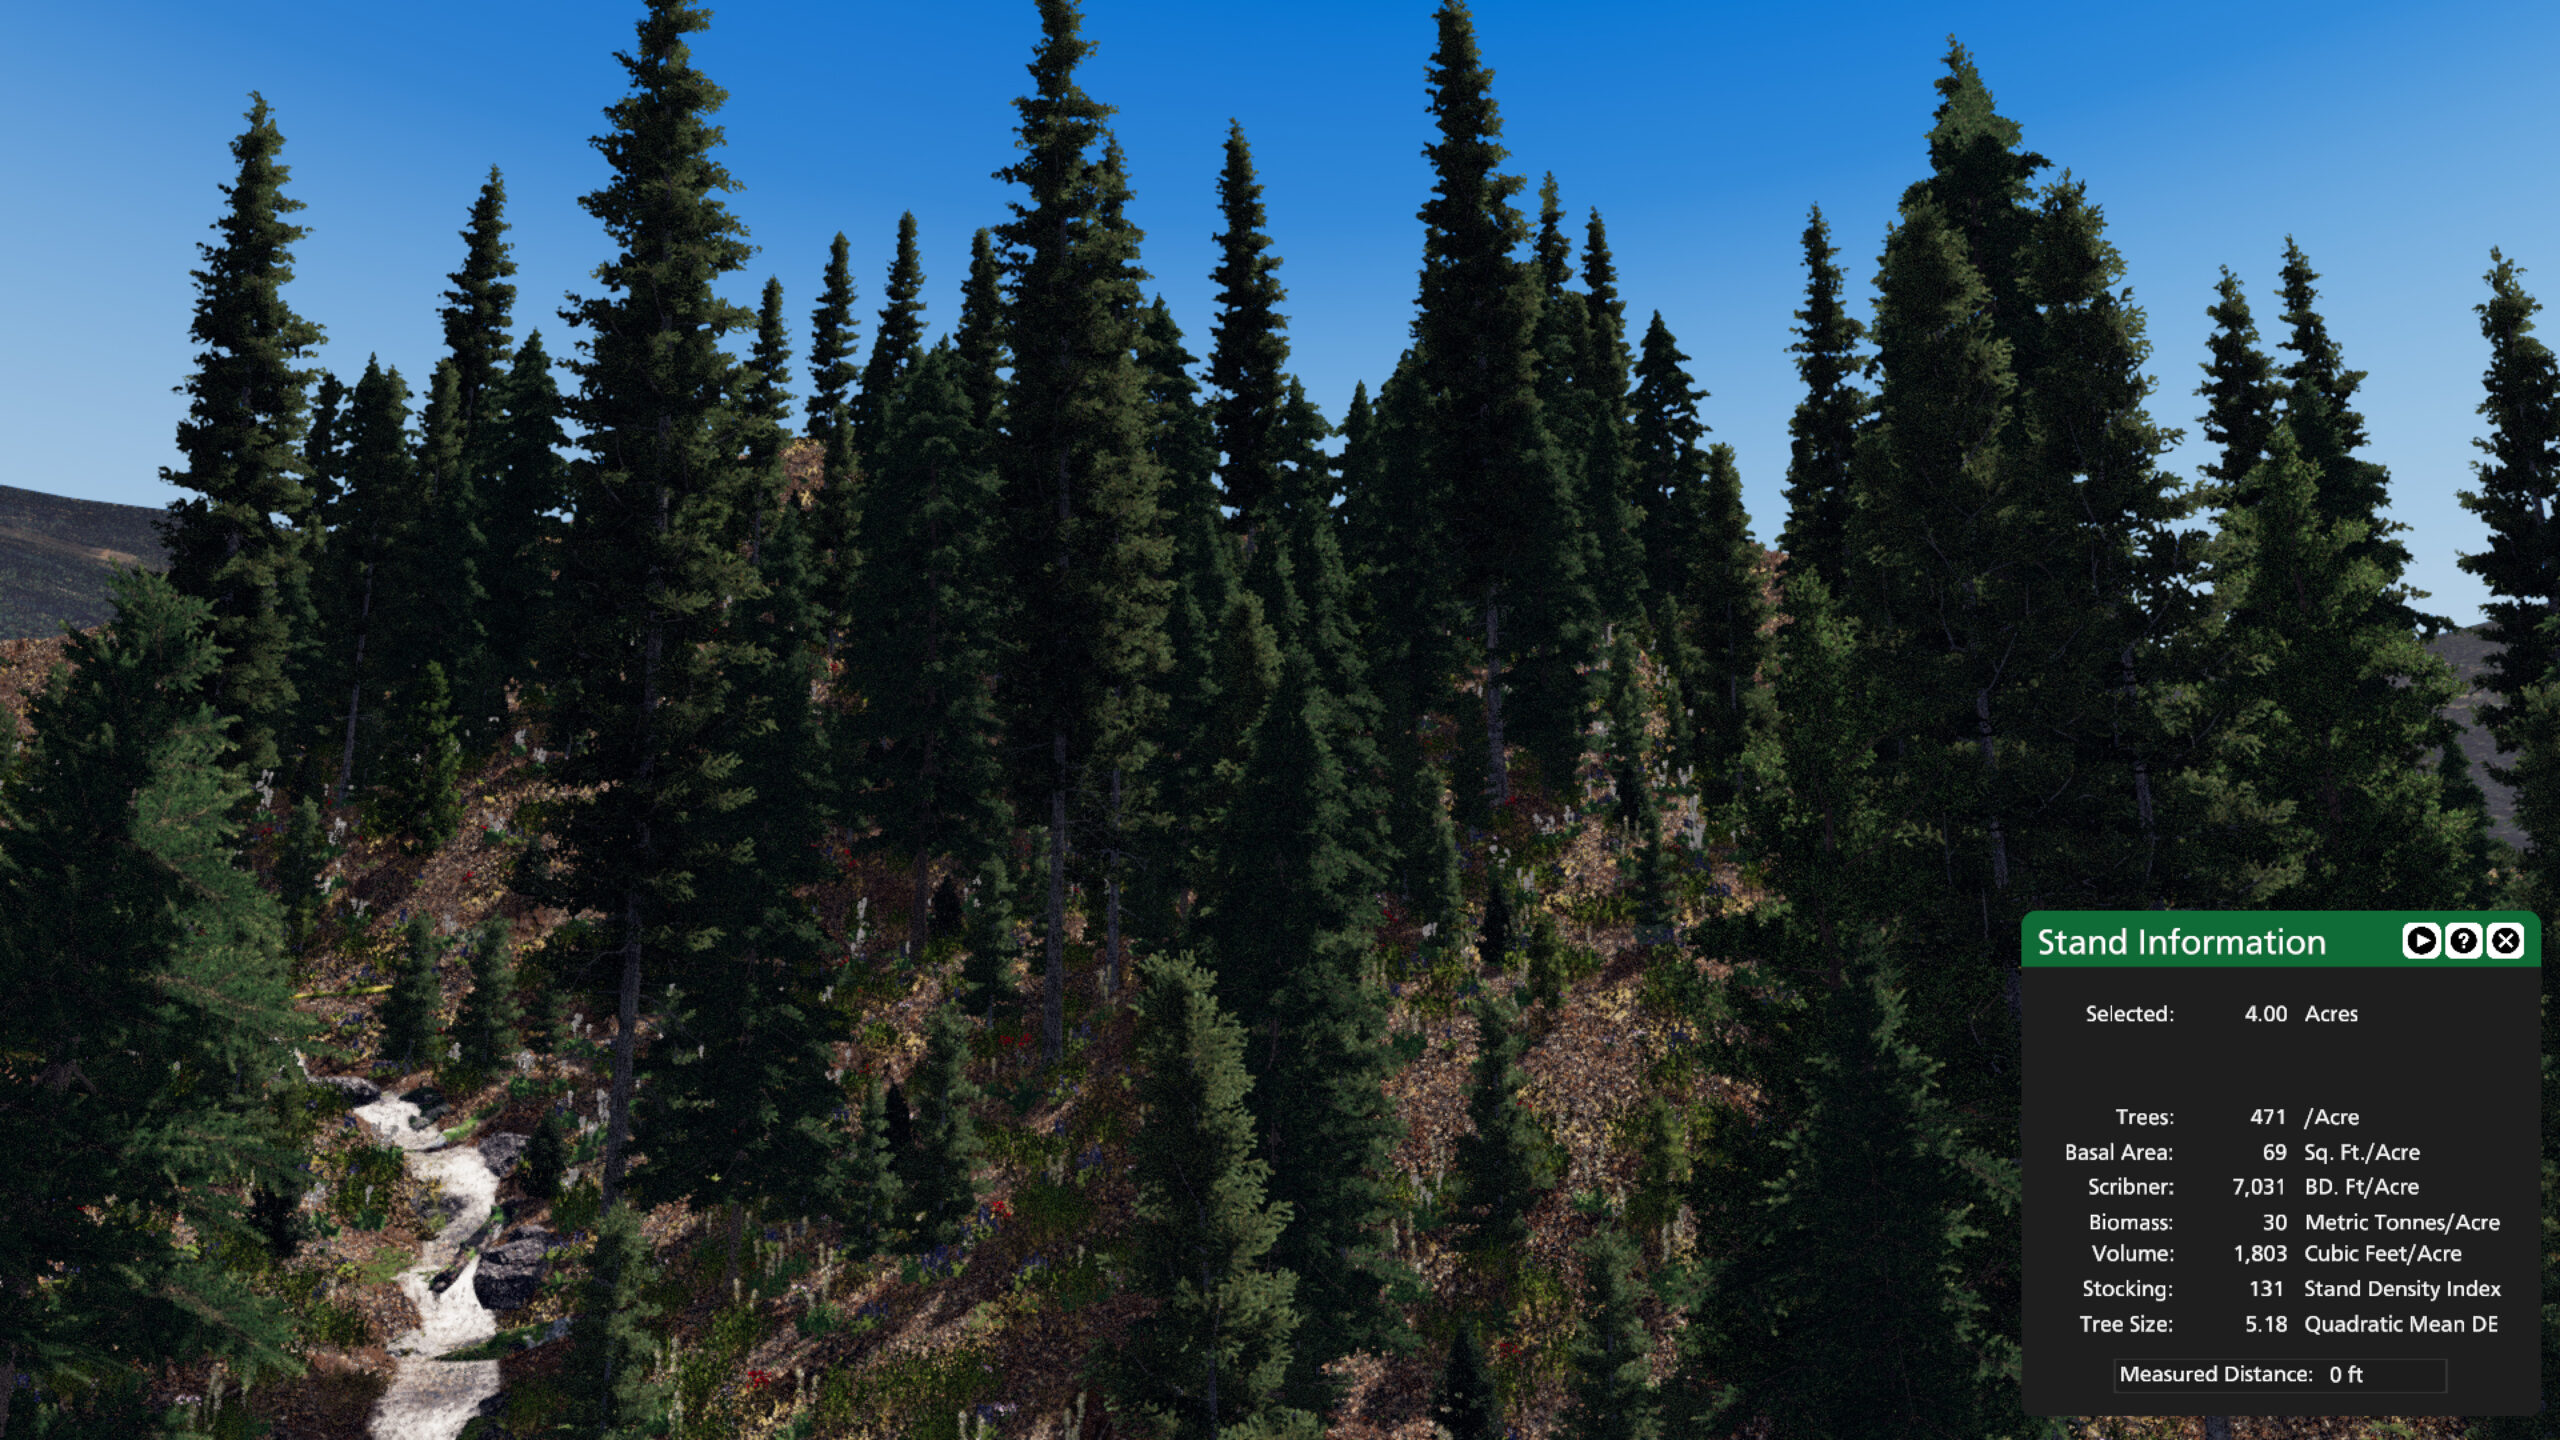
A high elevation spruce-fir stand near Kalispell, MT
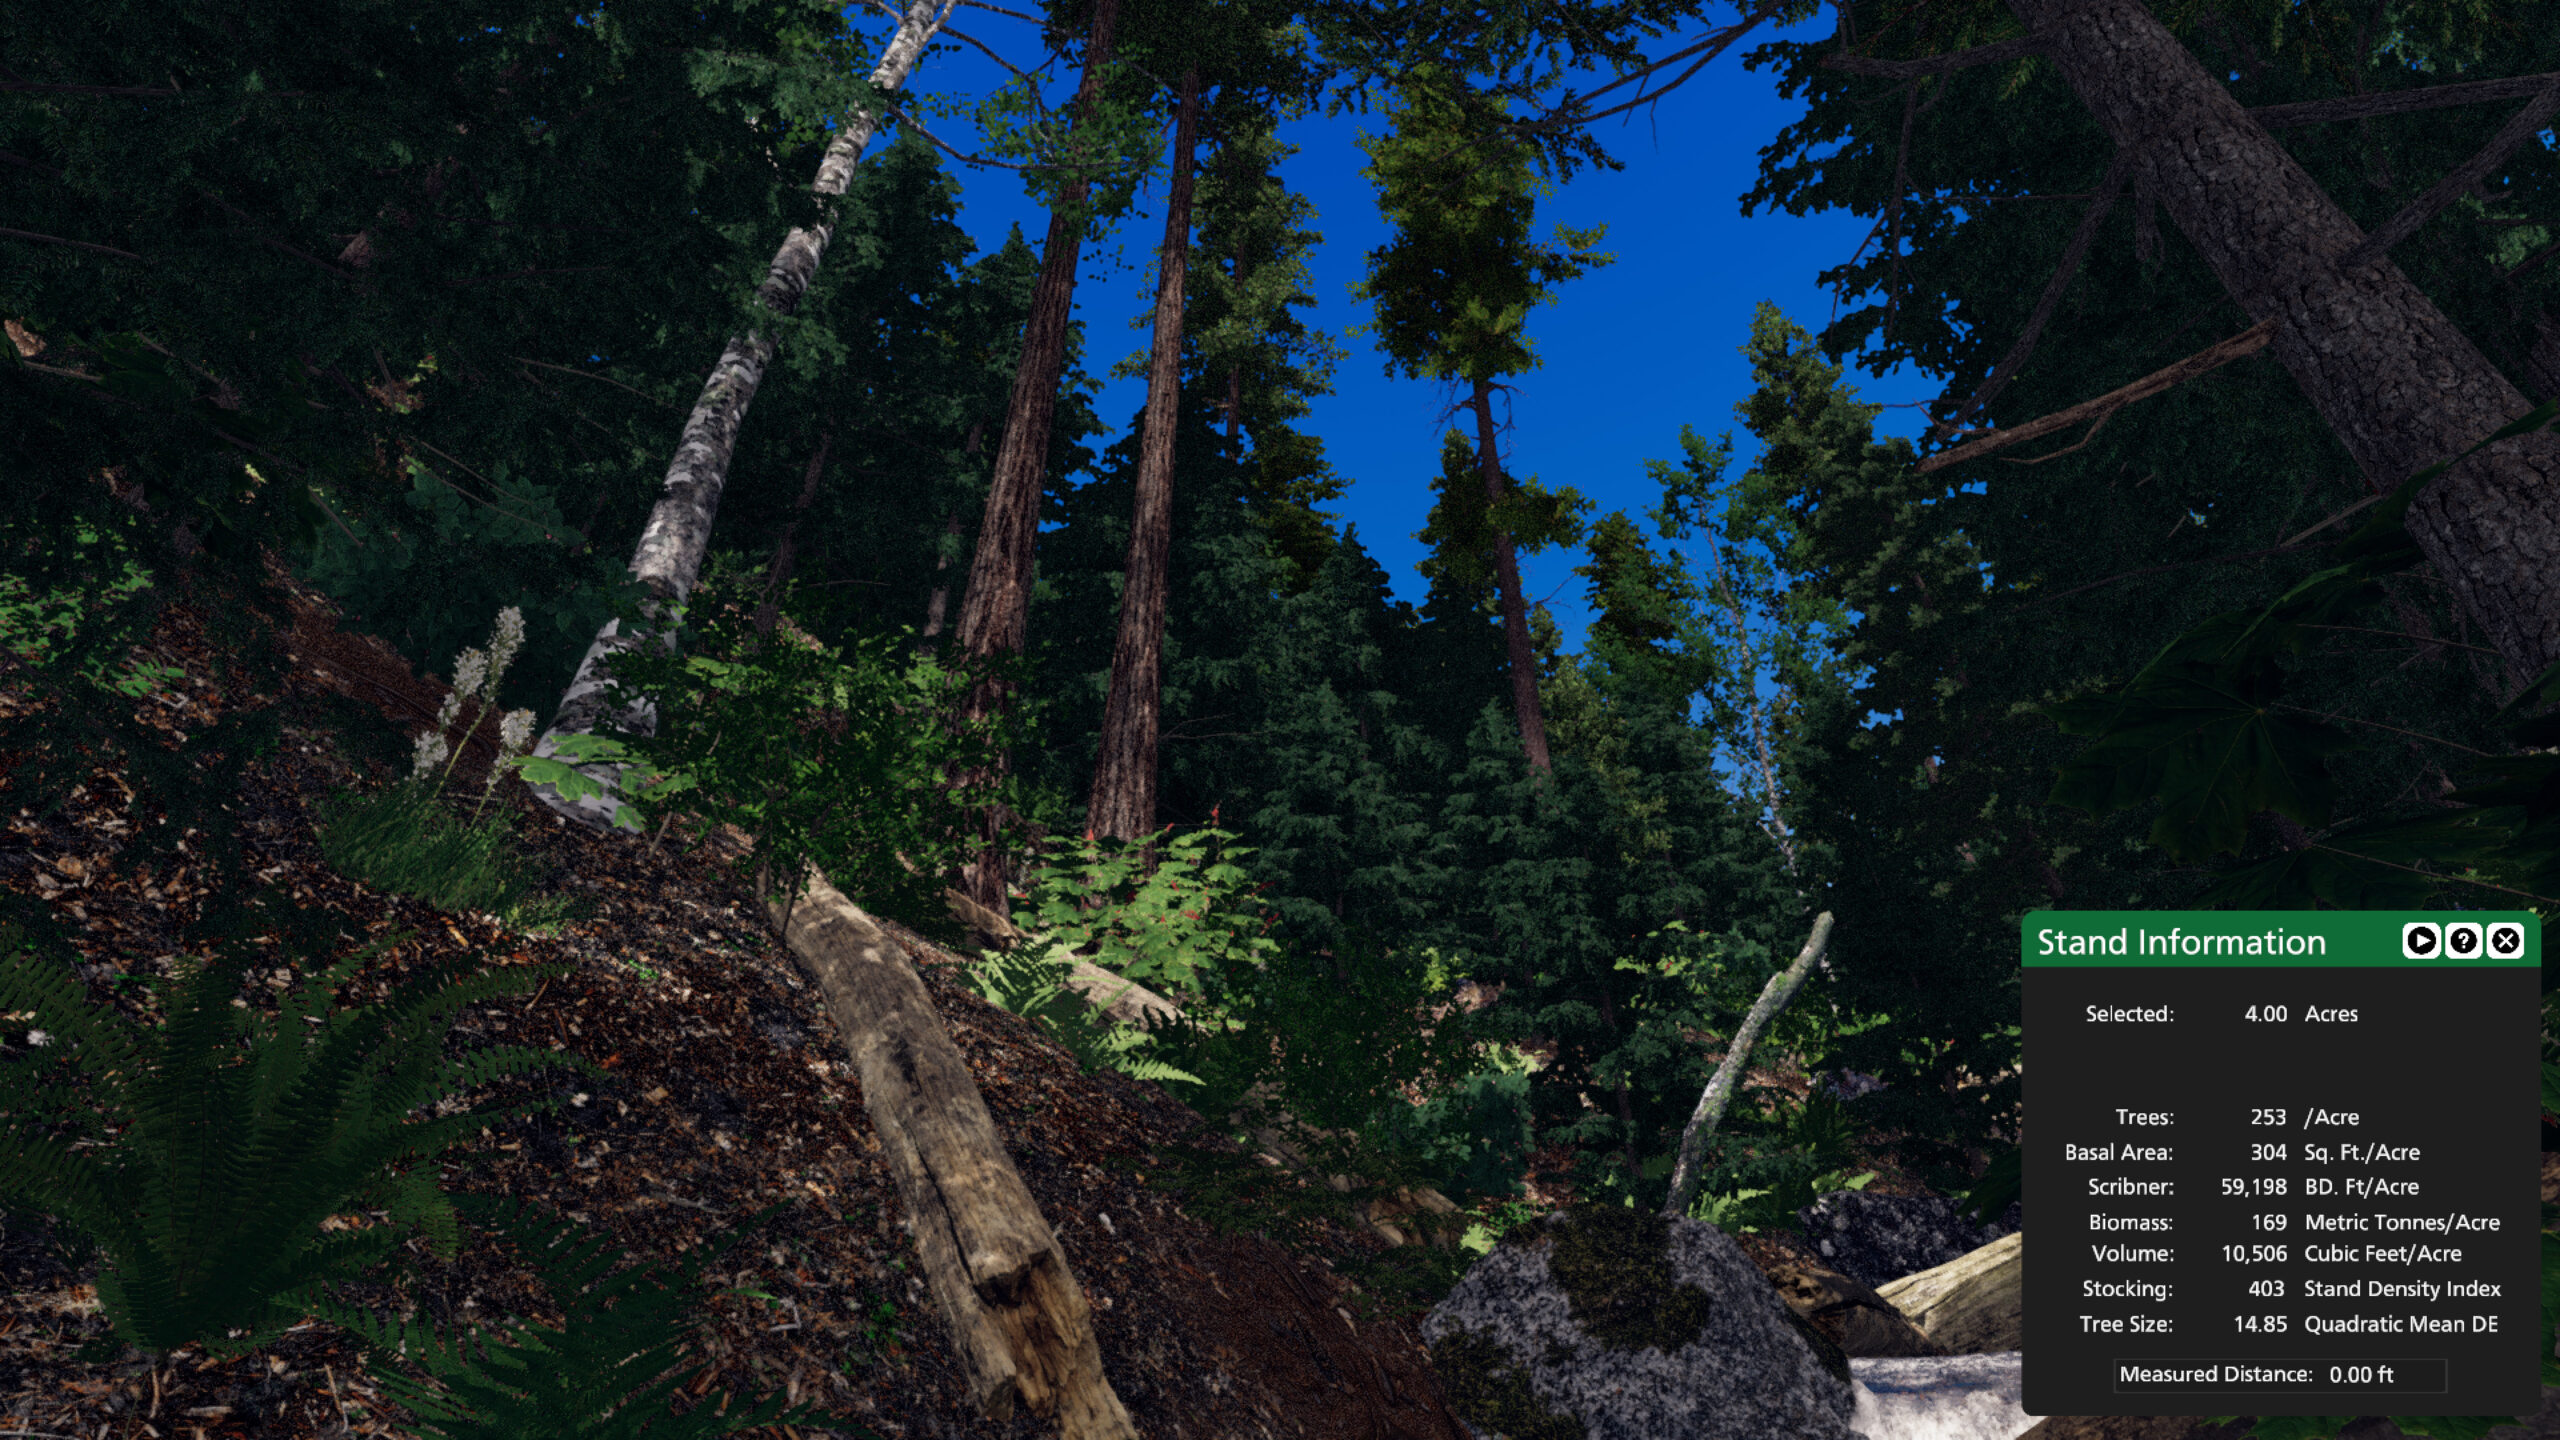
A complex stand near Port Angeles, WA. The overstory is composed of 30+ inch Douglas-fir and western redcedar. The understory is composed of western hemlock, grand fir, and red alder.
We encourage you to explore this massive source of data and build your own visualizations. Try exploring a new region or see if you can learn something new about an area that you know well. Let us know what you discover or what you could teach using this approach, we would love to hear from you.
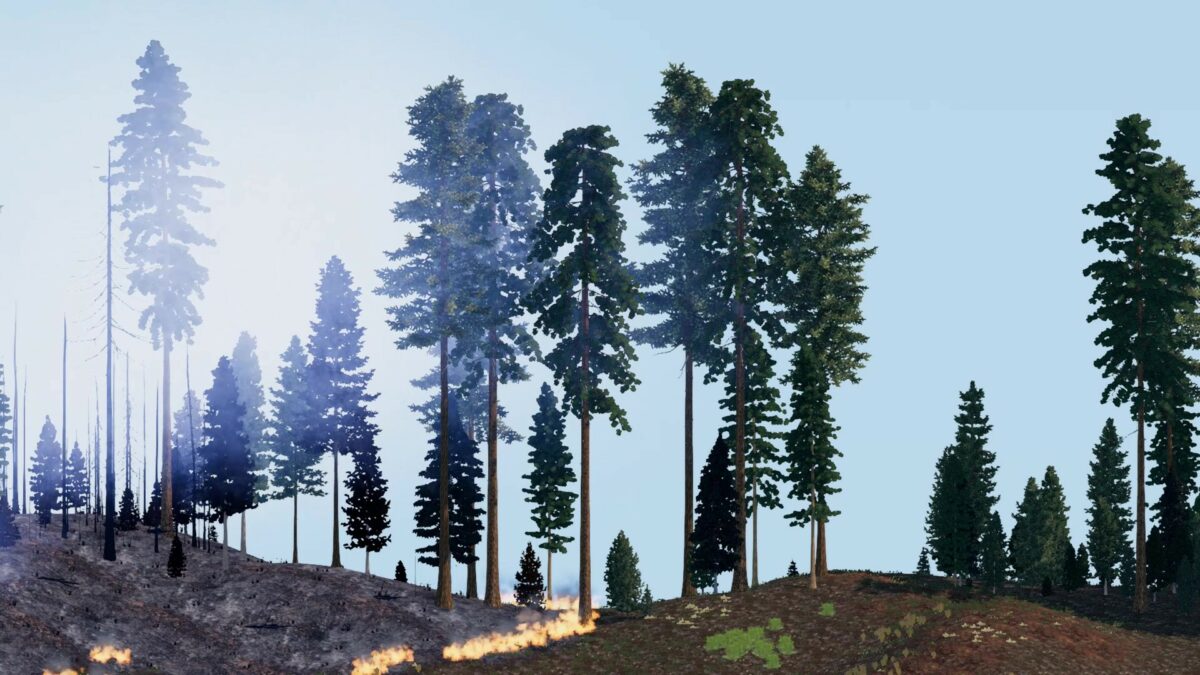
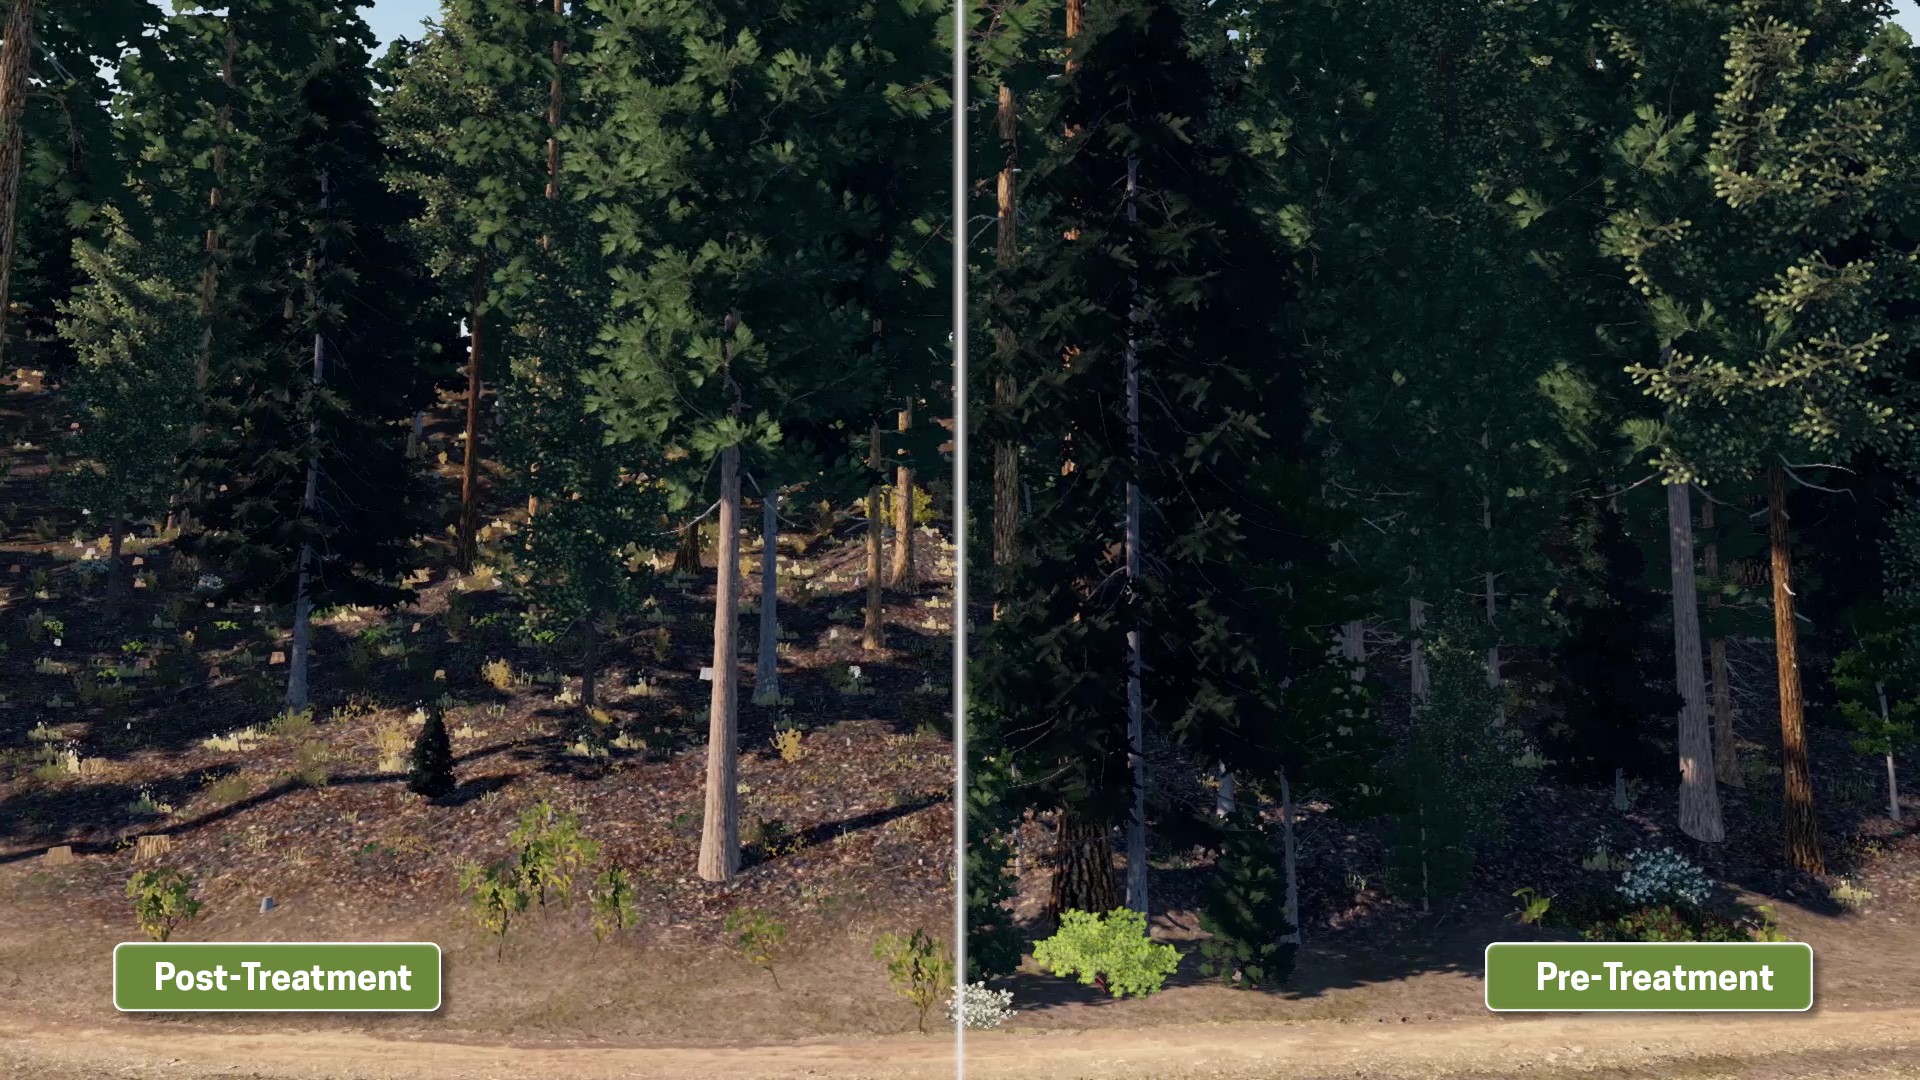
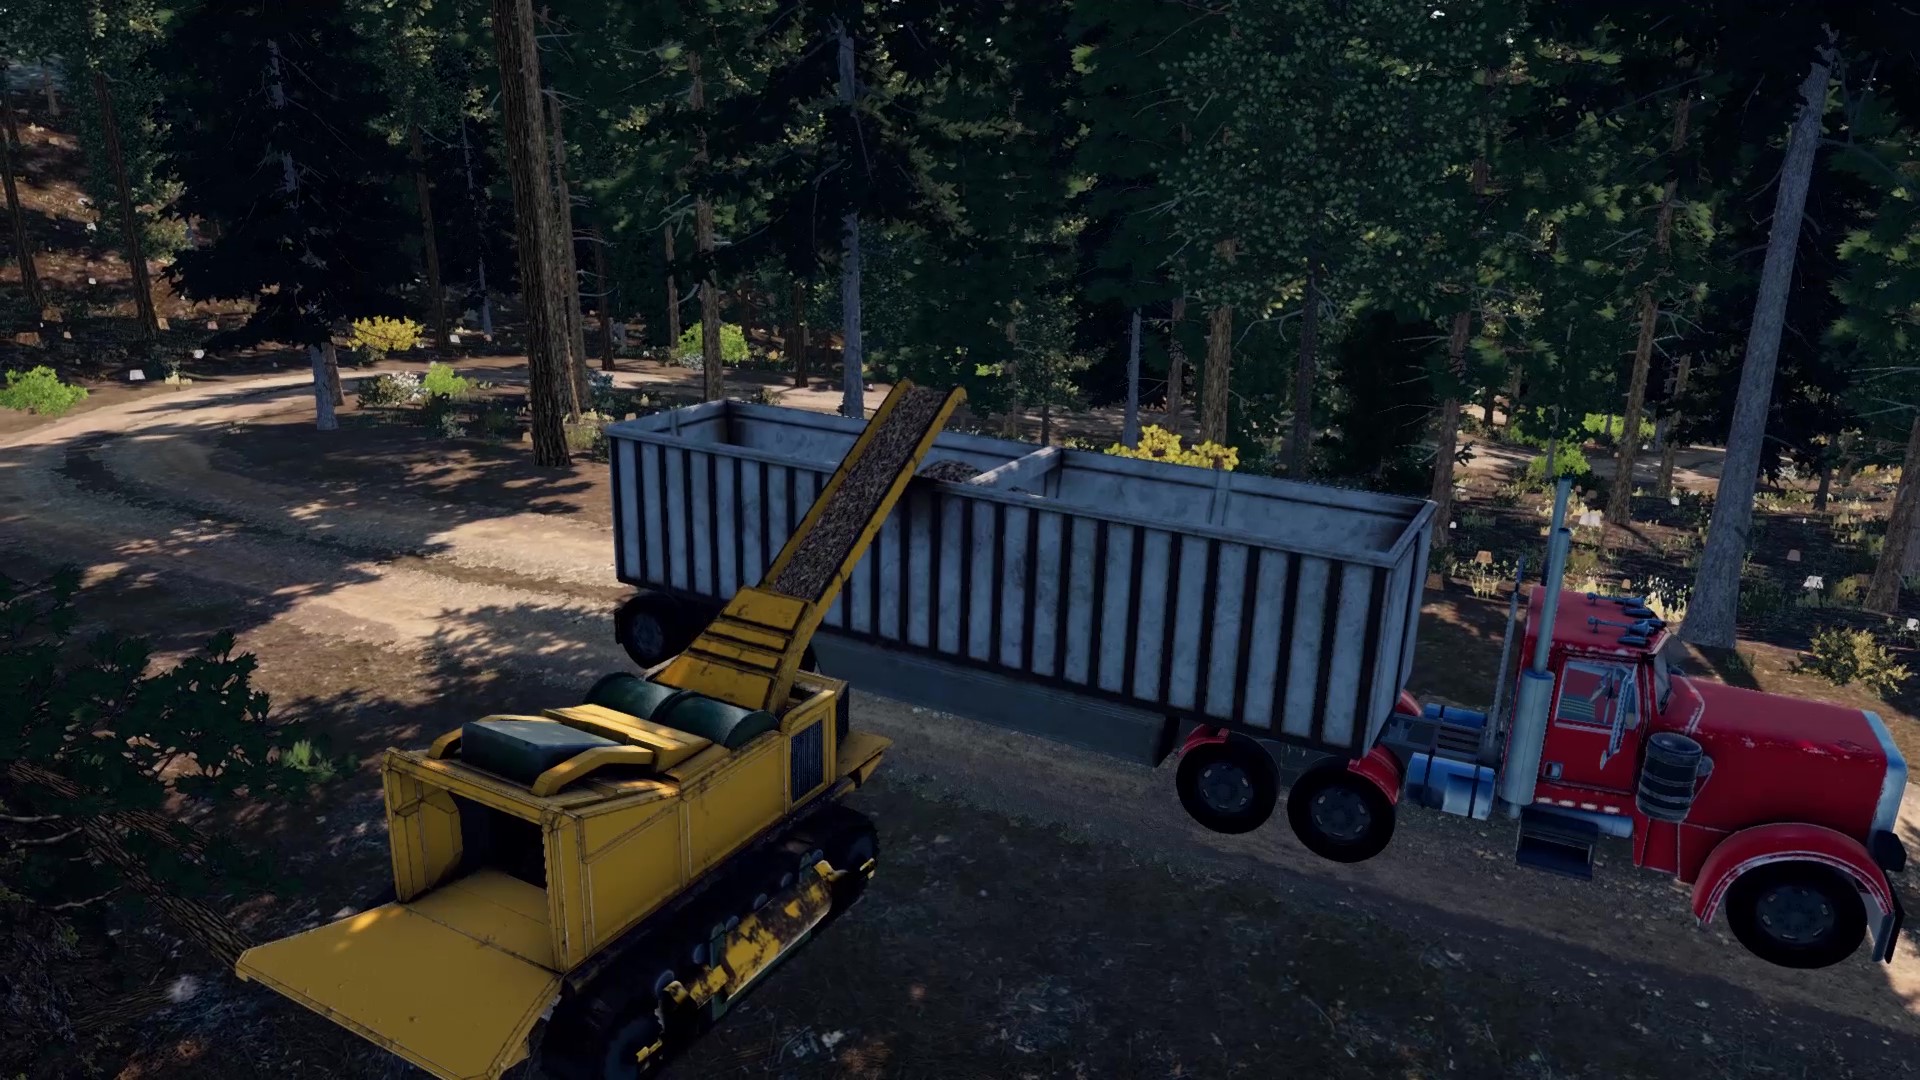
The future of forestry is here. Leading up to the public launch of our new forest visualization technology, Stand Designer, we would like to share the results from some of the first projects to use Visual Forester technology. For this blog, we are highlighting a video project that we completed in 2020 in collaboration with My Sierra Woods. The project was to create a short series of educational videos that assist small landowners in California with understanding the methods and benefits of understory thinning.
My Sierra Woods is a partnership between the American Forest Foundation and a multitude of local California organizations which helps to connect family forests with knowledgeable foresters and grant funding opportunities. The resources provided by My Sierra Woods help small landowners to actively manage their forestland or to replant and restore forests that have been impacted by fire. This work benefits landowners, communities, and forests by improving fire resiliency and forest health, particularly in California’s wildland-urban interface.
The Visual Forester team at Alpine LIS was happy to assist with the mission of My Sierra Woods. Using prototype Visual Forester software tools and some custom development, we produced digital visualizations depicting harvests, equipment, and wildfires—both historic and present. The Visual Forester team then used these visualizations to produce a three-part narrated video series which totals about ten minutes. This project involved a lot of exciting firsts and was a very fun challenge for the Visual Forester team.
For this video production, we took advantage of our developer environment and some prototype-only features to create unique and dynamic large-scale scenes. You won’t find all of these features in the first release of Stand Designer, but with enough support, we would love to continue developing new features for Visual Forester solutions.
Part of the fun of this project was the opportunity to step out of software development and into film production. Working closely with My Sierra Woods, we started by discussing some open-ended thoughts and ideas for the project, then funneled them down to create a set of specific project objectives, a target audience, and a distribution plan. With this framework in place, we went through a process of storyboarding and scriptwriting to plan out the videos. Then, we dove into building datasets, scenes, camera tracks, and video recordings. As the video recordings were wrapping up, we turned to narration and found a great voice actor from New York to provide the voice-over we were looking for. With all of the media in place, we edited together the final product and turned it over to My Sierra Woods to use and distribute.
My Sierra Woods now hosts these videos on a webpage titled Forestry 101 (note, this page is not searchable and you will need the direct link to see it). This webpage was constructed as a resource for California foresters who needed a visual aid to point to when helping landowners understand what to expect from an understory thinning on their property. The videos help the landowners to build a mental picture and an understanding of what the foresters are advising for the most common fuels reduction treatments. This helps build trust and confidence between the landowners and the foresters, helping projects to move forwards.
The foresters and partner organizations we heard from were very excited to get access to these visual resources and we have heard some great positive responses. In particular, viewers have praised the third video in the series which tells a visual story of resilient historic forests that were filled in over time by more dense and uniform forests, making them less resilient. It ends by showing how these risks can be reduced in part through active management like understory thinning.

Take a look at the webpage and watch the videos to judge the results for yourself. Additionally, My Sierra Woods has encouraged us to share these videos, so don’t hesitate to use them if they would be helpful in your own work and outreach.
This is just one example of the potential for Visual Forester technology to improve comprehension of forestry concepts. With the release of Stand Designer, we are very excited to see people and organizations like My Sierra Woods produce their own educational materials that help communities build a stronger understanding of their forests and management alternatives.
For more information about My Sierra Woods and about usage permissions for this video series, contact:
Chantz Joyce / cjoyce@forestfoundation.org
www.mysierrawoods.org
For more information about Visual Forester and other video content advice, contact:
Johnathan Tenny / jtenny@alpine-lis.com